Delaware vs Immigrants from China 5th Grade
COMPARE
Delaware
Immigrants from China
5th Grade
5th Grade Comparison
Delaware
Immigrants from China
97.8%
5TH GRADE
98.6/ 100
METRIC RATING
93rd/ 347
METRIC RANK
96.8%
5TH GRADE
0.5/ 100
METRIC RATING
259th/ 347
METRIC RANK
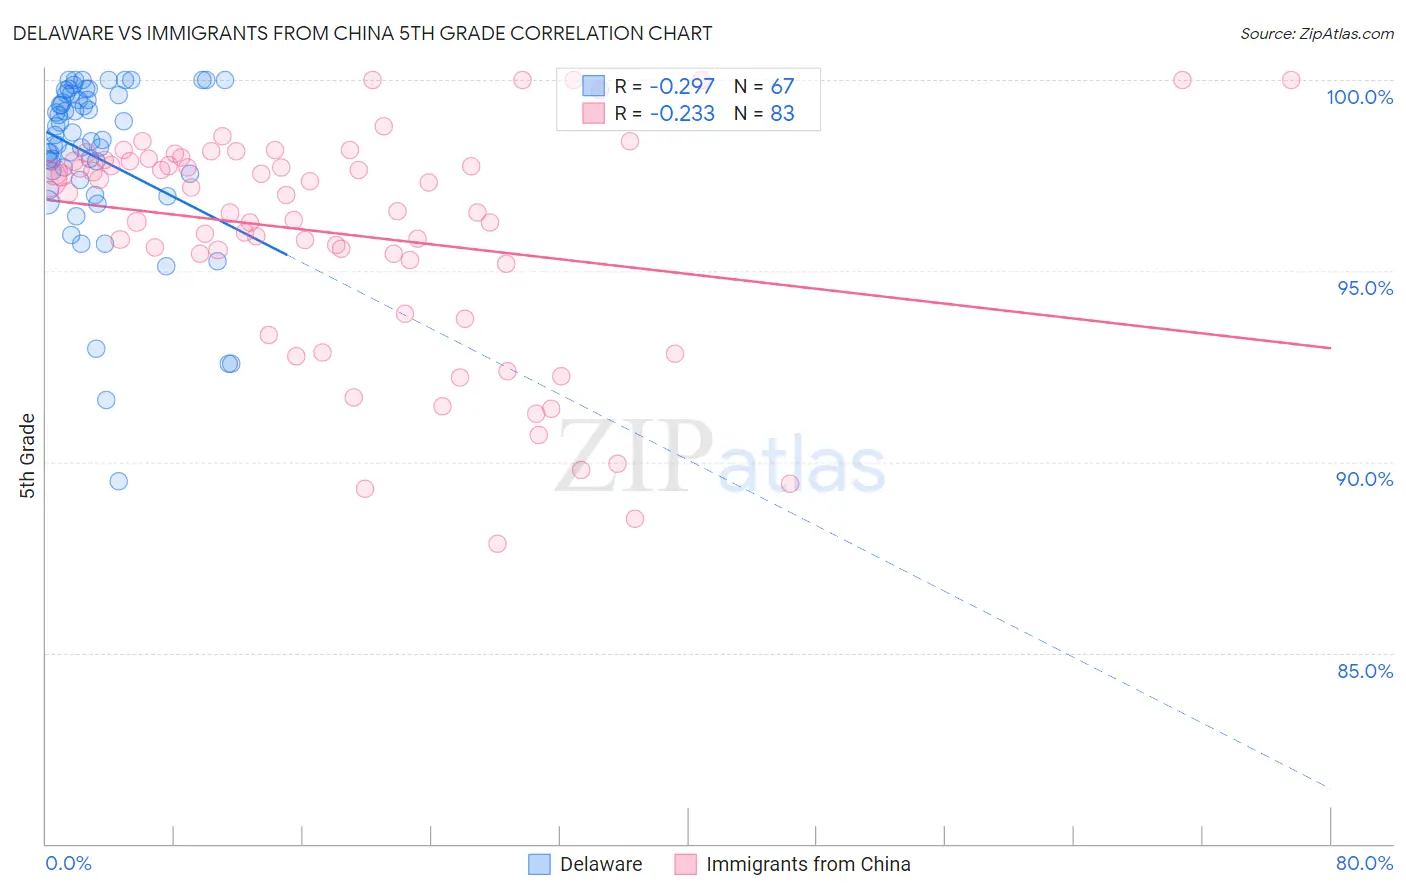
Delaware vs Immigrants from China 5th Grade Correlation Chart
The statistical analysis conducted on geographies consisting of 96,235,191 people shows a weak negative correlation between the proportion of Delaware and percentage of population with at least 5th grade education in the United States with a correlation coefficient (R) of -0.297 and weighted average of 97.8%. Similarly, the statistical analysis conducted on geographies consisting of 457,082,957 people shows a weak negative correlation between the proportion of Immigrants from China and percentage of population with at least 5th grade education in the United States with a correlation coefficient (R) of -0.233 and weighted average of 96.8%, a difference of 1.0%.
5th Grade Correlation Summary
| Measurement | Delaware | Immigrants from China |
| Minimum | 89.5% | 87.9% |
| Maximum | 100.0% | 100.0% |
| Range | 10.5% | 12.1% |
| Mean | 98.0% | 96.0% |
| Median | 98.4% | 97.0% |
| Interquartile 25% (IQ1) | 97.4% | 95.2% |
| Interquartile 75% (IQ3) | 99.6% | 97.9% |
| Interquartile Range (IQR) | 2.2% | 2.7% |
| Standard Deviation (Sample) | 2.2% | 3.0% |
| Standard Deviation (Population) | 2.2% | 2.9% |
Similar Demographics by 5th Grade
Demographics Similar to Delaware by 5th Grade
In terms of 5th grade, the demographic groups most similar to Delaware are Immigrants from Denmark (97.8%, a difference of 0.0%), Immigrants from South Africa (97.8%, a difference of 0.010%), Immigrants from Ireland (97.8%, a difference of 0.010%), Immigrants from Western Europe (97.8%, a difference of 0.010%), and Immigrants from Sweden (97.8%, a difference of 0.010%).
| Demographics | Rating | Rank | 5th Grade |
| Cypriots | 98.9 /100 | #86 | Exceptional 97.8% |
| Immigrants | Australia | 98.8 /100 | #87 | Exceptional 97.8% |
| Shoshone | 98.8 /100 | #88 | Exceptional 97.8% |
| Immigrants | South Africa | 98.8 /100 | #89 | Exceptional 97.8% |
| Immigrants | Ireland | 98.8 /100 | #90 | Exceptional 97.8% |
| Immigrants | Western Europe | 98.8 /100 | #91 | Exceptional 97.8% |
| Immigrants | Sweden | 98.7 /100 | #92 | Exceptional 97.8% |
| Delaware | 98.6 /100 | #93 | Exceptional 97.8% |
| Immigrants | Denmark | 98.6 /100 | #94 | Exceptional 97.8% |
| Romanians | 98.6 /100 | #95 | Exceptional 97.8% |
| Immigrants | Germany | 98.5 /100 | #96 | Exceptional 97.8% |
| Cree | 98.4 /100 | #97 | Exceptional 97.7% |
| Yugoslavians | 98.3 /100 | #98 | Exceptional 97.7% |
| Turks | 98.3 /100 | #99 | Exceptional 97.7% |
| Puget Sound Salish | 98.3 /100 | #100 | Exceptional 97.7% |
Demographics Similar to Immigrants from China by 5th Grade
In terms of 5th grade, the demographic groups most similar to Immigrants from China are Immigrants from Ethiopia (96.8%, a difference of 0.0%), Immigrants from Jamaica (96.8%, a difference of 0.020%), Immigrants from Sierra Leone (96.8%, a difference of 0.020%), Immigrants from Colombia (96.8%, a difference of 0.020%), and Peruvian (96.8%, a difference of 0.030%).
| Demographics | Rating | Rank | 5th Grade |
| Jamaicans | 0.9 /100 | #252 | Tragic 96.9% |
| Immigrants | Middle Africa | 0.8 /100 | #253 | Tragic 96.8% |
| Immigrants | Senegal | 0.8 /100 | #254 | Tragic 96.8% |
| South Americans | 0.7 /100 | #255 | Tragic 96.8% |
| Immigrants | Congo | 0.7 /100 | #256 | Tragic 96.8% |
| Peruvians | 0.6 /100 | #257 | Tragic 96.8% |
| Immigrants | Ethiopia | 0.5 /100 | #258 | Tragic 96.8% |
| Immigrants | China | 0.5 /100 | #259 | Tragic 96.8% |
| Immigrants | Jamaica | 0.4 /100 | #260 | Tragic 96.8% |
| Immigrants | Sierra Leone | 0.4 /100 | #261 | Tragic 96.8% |
| Immigrants | Colombia | 0.4 /100 | #262 | Tragic 96.8% |
| Immigrants | Uzbekistan | 0.3 /100 | #263 | Tragic 96.8% |
| West Indians | 0.3 /100 | #264 | Tragic 96.8% |
| Taiwanese | 0.3 /100 | #265 | Tragic 96.7% |
| Immigrants | Nigeria | 0.3 /100 | #266 | Tragic 96.7% |