Crow vs Immigrants from Guyana Bachelor's Degree
COMPARE
Crow
Immigrants from Guyana
Bachelor's Degree
Bachelor's Degree Comparison
Crow
Immigrants from Guyana
27.7%
BACHELOR'S DEGREE
0.0/ 100
METRIC RATING
328th/ 347
METRIC RANK
33.9%
BACHELOR'S DEGREE
1.4/ 100
METRIC RATING
243rd/ 347
METRIC RANK
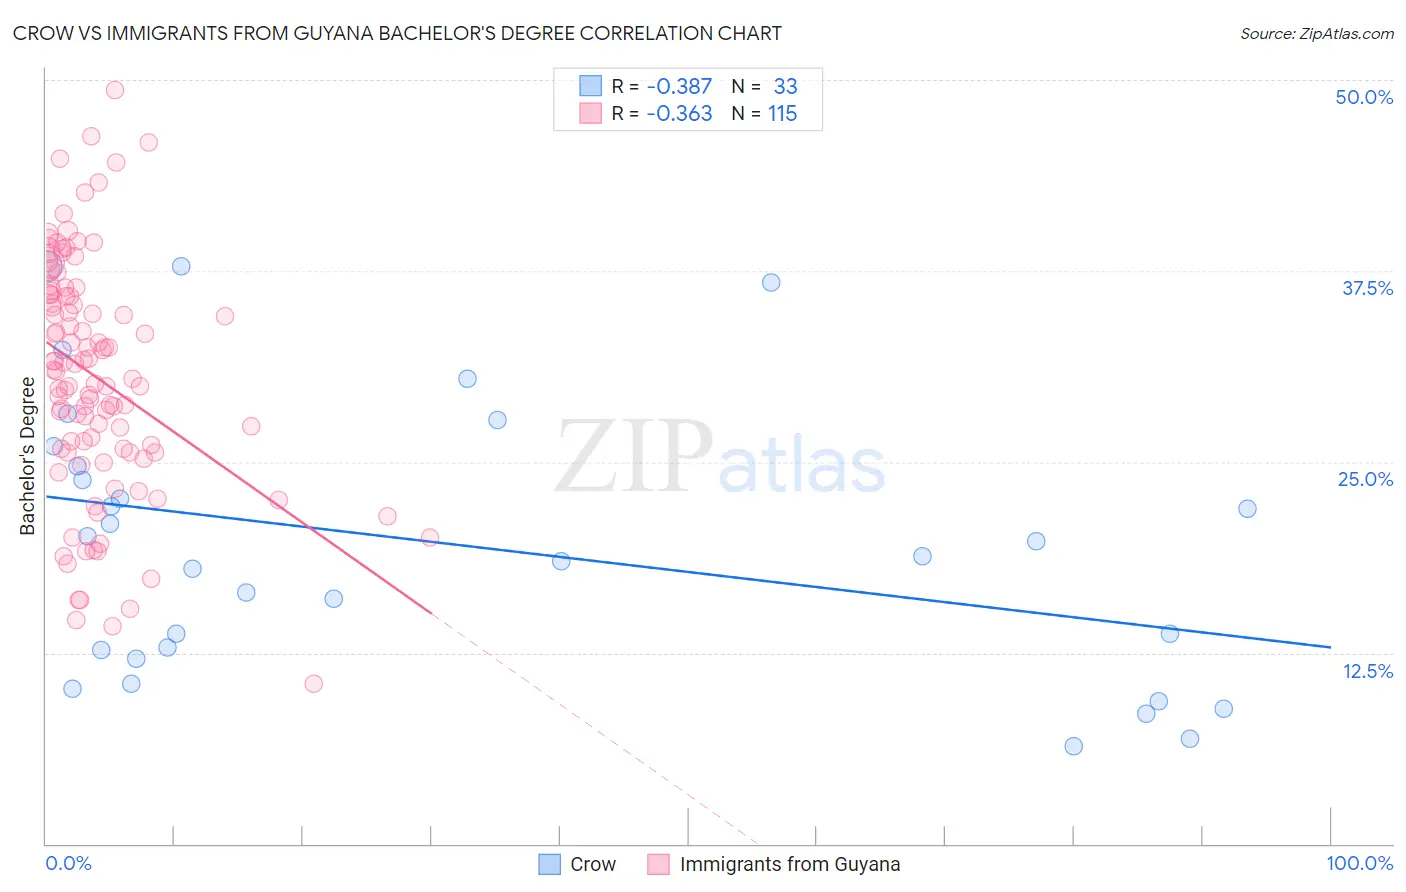
Crow vs Immigrants from Guyana Bachelor's Degree Correlation Chart
The statistical analysis conducted on geographies consisting of 59,206,788 people shows a mild negative correlation between the proportion of Crow and percentage of population with at least bachelor's degree education in the United States with a correlation coefficient (R) of -0.387 and weighted average of 27.7%. Similarly, the statistical analysis conducted on geographies consisting of 183,738,689 people shows a mild negative correlation between the proportion of Immigrants from Guyana and percentage of population with at least bachelor's degree education in the United States with a correlation coefficient (R) of -0.363 and weighted average of 33.9%, a difference of 22.3%.
Bachelor's Degree Correlation Summary
| Measurement | Crow | Immigrants from Guyana |
| Minimum | 6.4% | 10.5% |
| Maximum | 37.8% | 49.4% |
| Range | 31.4% | 38.9% |
| Mean | 19.6% | 30.5% |
| Median | 18.8% | 31.0% |
| Interquartile 25% (IQ1) | 12.4% | 25.6% |
| Interquartile 75% (IQ3) | 25.3% | 36.0% |
| Interquartile Range (IQR) | 12.9% | 10.3% |
| Standard Deviation (Sample) | 9.0% | 7.7% |
| Standard Deviation (Population) | 8.8% | 7.7% |
Similar Demographics by Bachelor's Degree
Demographics Similar to Crow by Bachelor's Degree
In terms of bachelor's degree, the demographic groups most similar to Crow are Immigrants from Central America (27.5%, a difference of 1.0%), Spanish American Indian (27.5%, a difference of 1.1%), Paiute (28.1%, a difference of 1.2%), Immigrants from the Azores (27.3%, a difference of 1.5%), and Menominee (27.3%, a difference of 1.7%).
| Demographics | Rating | Rank | Bachelor's Degree |
| Alaskan Athabascans | 0.0 /100 | #321 | Tragic 28.8% |
| Tsimshian | 0.0 /100 | #322 | Tragic 28.8% |
| Fijians | 0.0 /100 | #323 | Tragic 28.7% |
| Dutch West Indians | 0.0 /100 | #324 | Tragic 28.5% |
| Pennsylvania Germans | 0.0 /100 | #325 | Tragic 28.4% |
| Apache | 0.0 /100 | #326 | Tragic 28.3% |
| Paiute | 0.0 /100 | #327 | Tragic 28.1% |
| Crow | 0.0 /100 | #328 | Tragic 27.7% |
| Immigrants | Central America | 0.0 /100 | #329 | Tragic 27.5% |
| Spanish American Indians | 0.0 /100 | #330 | Tragic 27.5% |
| Immigrants | Azores | 0.0 /100 | #331 | Tragic 27.3% |
| Menominee | 0.0 /100 | #332 | Tragic 27.3% |
| Mexicans | 0.0 /100 | #333 | Tragic 27.1% |
| Arapaho | 0.0 /100 | #334 | Tragic 26.6% |
| Natives/Alaskans | 0.0 /100 | #335 | Tragic 26.3% |
Demographics Similar to Immigrants from Guyana by Bachelor's Degree
In terms of bachelor's degree, the demographic groups most similar to Immigrants from Guyana are Delaware (33.8%, a difference of 0.50%), Immigrants from Fiji (33.7%, a difference of 0.59%), Nonimmigrants (34.2%, a difference of 0.64%), Immigrants from Cambodia (34.2%, a difference of 0.71%), and Jamaican (33.6%, a difference of 0.96%).
| Demographics | Rating | Rank | Bachelor's Degree |
| Liberians | 2.8 /100 | #236 | Tragic 34.6% |
| Tlingit-Haida | 2.8 /100 | #237 | Tragic 34.6% |
| Guyanese | 2.5 /100 | #238 | Tragic 34.5% |
| British West Indians | 2.5 /100 | #239 | Tragic 34.5% |
| Tongans | 2.0 /100 | #240 | Tragic 34.3% |
| Immigrants | Cambodia | 1.9 /100 | #241 | Tragic 34.2% |
| Immigrants | Nonimmigrants | 1.8 /100 | #242 | Tragic 34.2% |
| Immigrants | Guyana | 1.4 /100 | #243 | Tragic 33.9% |
| Delaware | 1.2 /100 | #244 | Tragic 33.8% |
| Immigrants | Fiji | 1.2 /100 | #245 | Tragic 33.7% |
| Jamaicans | 1.0 /100 | #246 | Tragic 33.6% |
| Immigrants | Congo | 1.0 /100 | #247 | Tragic 33.6% |
| Cree | 1.0 /100 | #248 | Tragic 33.6% |
| Immigrants | Liberia | 0.9 /100 | #249 | Tragic 33.5% |
| Indonesians | 0.9 /100 | #250 | Tragic 33.5% |