Crow vs Immigrants from Zaire Doctorate Degree
COMPARE
Crow
Immigrants from Zaire
Doctorate Degree
Doctorate Degree Comparison
Crow
Immigrants from Zaire
1.5%
DOCTORATE DEGREE
0.5/ 100
METRIC RATING
269th/ 347
METRIC RANK
2.0%
DOCTORATE DEGREE
91.1/ 100
METRIC RATING
128th/ 347
METRIC RANK
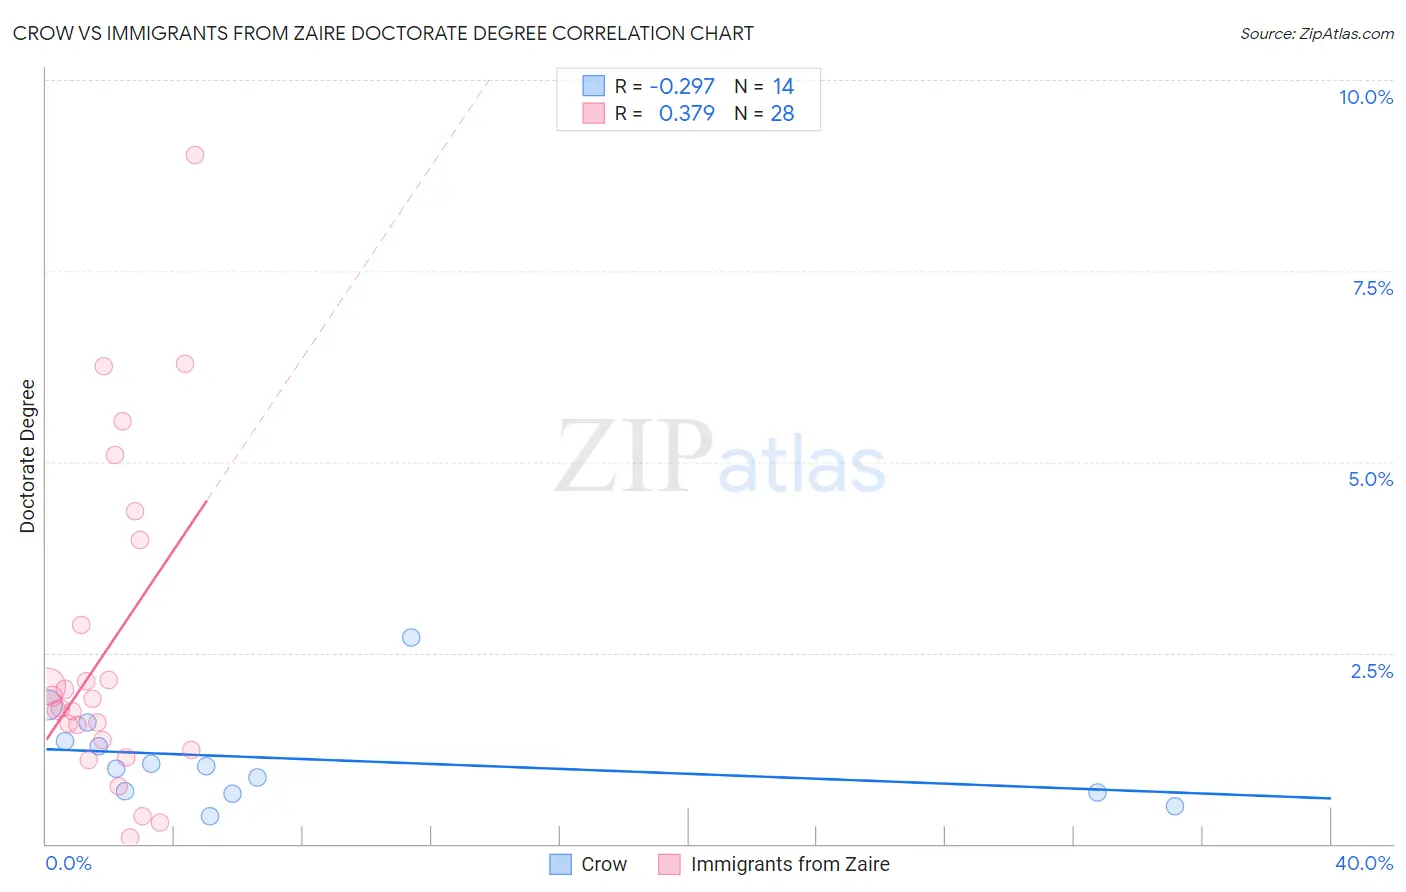
Crow vs Immigrants from Zaire Doctorate Degree Correlation Chart
The statistical analysis conducted on geographies consisting of 58,797,777 people shows a weak negative correlation between the proportion of Crow and percentage of population with at least doctorate degree education in the United States with a correlation coefficient (R) of -0.297 and weighted average of 1.5%. Similarly, the statistical analysis conducted on geographies consisting of 107,152,130 people shows a mild positive correlation between the proportion of Immigrants from Zaire and percentage of population with at least doctorate degree education in the United States with a correlation coefficient (R) of 0.379 and weighted average of 2.0%, a difference of 35.1%.
Doctorate Degree Correlation Summary
| Measurement | Crow | Immigrants from Zaire |
| Minimum | 0.37% | 0.076% |
| Maximum | 2.7% | 9.0% |
| Range | 2.3% | 8.9% |
| Mean | 1.1% | 2.6% |
| Median | 1.00% | 1.8% |
| Interquartile 25% (IQ1) | 0.67% | 1.3% |
| Interquartile 75% (IQ3) | 1.3% | 3.4% |
| Interquartile Range (IQR) | 0.67% | 2.1% |
| Standard Deviation (Sample) | 0.62% | 2.1% |
| Standard Deviation (Population) | 0.60% | 2.1% |
Similar Demographics by Doctorate Degree
Demographics Similar to Crow by Doctorate Degree
In terms of doctorate degree, the demographic groups most similar to Crow are Salvadoran (1.5%, a difference of 0.030%), Kiowa (1.5%, a difference of 0.090%), U.S. Virgin Islander (1.5%, a difference of 0.090%), Immigrants from Trinidad and Tobago (1.5%, a difference of 0.10%), and Immigrants from Barbados (1.5%, a difference of 0.19%).
| Demographics | Rating | Rank | Doctorate Degree |
| Chickasaw | 0.7 /100 | #262 | Tragic 1.5% |
| Immigrants | Bahamas | 0.7 /100 | #263 | Tragic 1.5% |
| Blackfeet | 0.7 /100 | #264 | Tragic 1.5% |
| Nicaraguans | 0.6 /100 | #265 | Tragic 1.5% |
| Immigrants | Liberia | 0.5 /100 | #266 | Tragic 1.5% |
| Kiowa | 0.5 /100 | #267 | Tragic 1.5% |
| U.S. Virgin Islanders | 0.5 /100 | #268 | Tragic 1.5% |
| Crow | 0.5 /100 | #269 | Tragic 1.5% |
| Salvadorans | 0.5 /100 | #270 | Tragic 1.5% |
| Immigrants | Trinidad and Tobago | 0.5 /100 | #271 | Tragic 1.5% |
| Immigrants | Barbados | 0.4 /100 | #272 | Tragic 1.5% |
| Sioux | 0.4 /100 | #273 | Tragic 1.5% |
| Yaqui | 0.4 /100 | #274 | Tragic 1.5% |
| Aleuts | 0.4 /100 | #275 | Tragic 1.5% |
| Paiute | 0.4 /100 | #276 | Tragic 1.5% |
Demographics Similar to Immigrants from Zaire by Doctorate Degree
In terms of doctorate degree, the demographic groups most similar to Immigrants from Zaire are Canadian (2.0%, a difference of 0.22%), Immigrants from Ukraine (2.0%, a difference of 0.22%), Immigrants from Sierra Leone (2.0%, a difference of 0.36%), Palestinian (2.0%, a difference of 0.42%), and Jordanian (2.0%, a difference of 0.46%).
| Demographics | Rating | Rank | Doctorate Degree |
| Immigrants | Jordan | 94.8 /100 | #121 | Exceptional 2.0% |
| Immigrants | Southern Europe | 94.7 /100 | #122 | Exceptional 2.0% |
| Croatians | 94.0 /100 | #123 | Exceptional 2.0% |
| Ute | 93.2 /100 | #124 | Exceptional 2.0% |
| Moroccans | 93.0 /100 | #125 | Exceptional 2.0% |
| Jordanians | 92.1 /100 | #126 | Exceptional 2.0% |
| Palestinians | 92.0 /100 | #127 | Exceptional 2.0% |
| Immigrants | Zaire | 91.1 /100 | #128 | Exceptional 2.0% |
| Canadians | 90.6 /100 | #129 | Exceptional 2.0% |
| Immigrants | Ukraine | 90.5 /100 | #130 | Exceptional 2.0% |
| Immigrants | Sierra Leone | 90.2 /100 | #131 | Exceptional 2.0% |
| Scottish | 89.4 /100 | #132 | Excellent 2.0% |
| Immigrants | Uzbekistan | 89.3 /100 | #133 | Excellent 2.0% |
| Immigrants | Cameroon | 88.9 /100 | #134 | Excellent 2.0% |
| Serbians | 88.7 /100 | #135 | Excellent 2.0% |