Crow vs Immigrants from Grenada Doctorate Degree
COMPARE
Crow
Immigrants from Grenada
Doctorate Degree
Doctorate Degree Comparison
Crow
Immigrants from Grenada
1.5%
DOCTORATE DEGREE
0.5/ 100
METRIC RATING
269th/ 347
METRIC RANK
1.4%
DOCTORATE DEGREE
0.1/ 100
METRIC RATING
309th/ 347
METRIC RANK
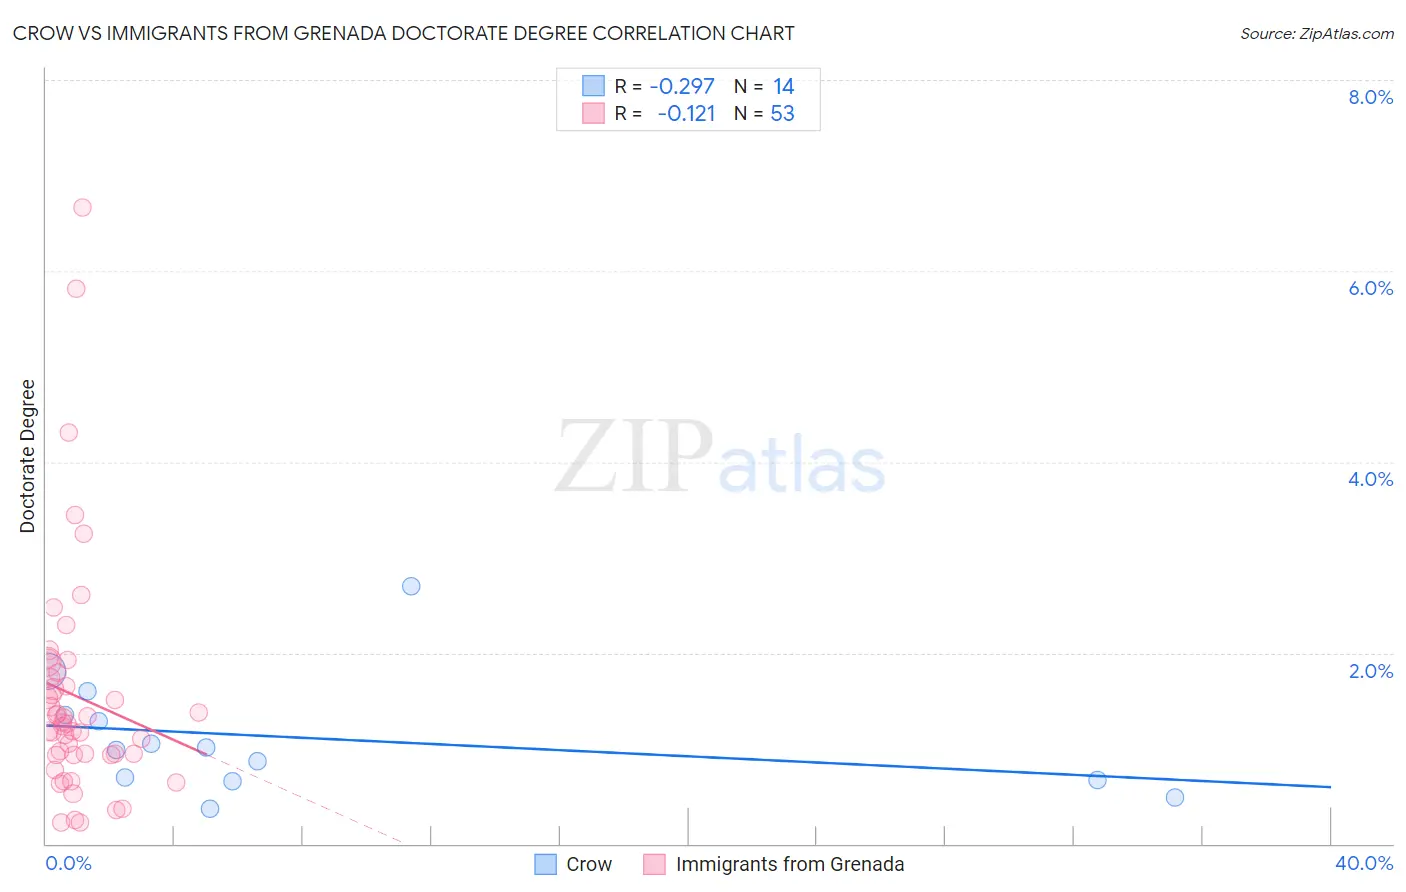
Crow vs Immigrants from Grenada Doctorate Degree Correlation Chart
The statistical analysis conducted on geographies consisting of 58,797,777 people shows a weak negative correlation between the proportion of Crow and percentage of population with at least doctorate degree education in the United States with a correlation coefficient (R) of -0.297 and weighted average of 1.5%. Similarly, the statistical analysis conducted on geographies consisting of 67,051,362 people shows a poor negative correlation between the proportion of Immigrants from Grenada and percentage of population with at least doctorate degree education in the United States with a correlation coefficient (R) of -0.121 and weighted average of 1.4%, a difference of 7.8%.
Doctorate Degree Correlation Summary
| Measurement | Crow | Immigrants from Grenada |
| Minimum | 0.37% | 0.22% |
| Maximum | 2.7% | 6.7% |
| Range | 2.3% | 6.4% |
| Mean | 1.1% | 1.5% |
| Median | 1.00% | 1.3% |
| Interquartile 25% (IQ1) | 0.67% | 0.93% |
| Interquartile 75% (IQ3) | 1.3% | 1.8% |
| Interquartile Range (IQR) | 0.67% | 0.83% |
| Standard Deviation (Sample) | 0.62% | 1.2% |
| Standard Deviation (Population) | 0.60% | 1.2% |
Similar Demographics by Doctorate Degree
Demographics Similar to Crow by Doctorate Degree
In terms of doctorate degree, the demographic groups most similar to Crow are Salvadoran (1.5%, a difference of 0.030%), Kiowa (1.5%, a difference of 0.090%), U.S. Virgin Islander (1.5%, a difference of 0.090%), Immigrants from Trinidad and Tobago (1.5%, a difference of 0.10%), and Immigrants from Barbados (1.5%, a difference of 0.19%).
| Demographics | Rating | Rank | Doctorate Degree |
| Chickasaw | 0.7 /100 | #262 | Tragic 1.5% |
| Immigrants | Bahamas | 0.7 /100 | #263 | Tragic 1.5% |
| Blackfeet | 0.7 /100 | #264 | Tragic 1.5% |
| Nicaraguans | 0.6 /100 | #265 | Tragic 1.5% |
| Immigrants | Liberia | 0.5 /100 | #266 | Tragic 1.5% |
| Kiowa | 0.5 /100 | #267 | Tragic 1.5% |
| U.S. Virgin Islanders | 0.5 /100 | #268 | Tragic 1.5% |
| Crow | 0.5 /100 | #269 | Tragic 1.5% |
| Salvadorans | 0.5 /100 | #270 | Tragic 1.5% |
| Immigrants | Trinidad and Tobago | 0.5 /100 | #271 | Tragic 1.5% |
| Immigrants | Barbados | 0.4 /100 | #272 | Tragic 1.5% |
| Sioux | 0.4 /100 | #273 | Tragic 1.5% |
| Yaqui | 0.4 /100 | #274 | Tragic 1.5% |
| Aleuts | 0.4 /100 | #275 | Tragic 1.5% |
| Paiute | 0.4 /100 | #276 | Tragic 1.5% |
Demographics Similar to Immigrants from Grenada by Doctorate Degree
In terms of doctorate degree, the demographic groups most similar to Immigrants from Grenada are Immigrants from Jamaica (1.4%, a difference of 0.30%), Immigrants from Laos (1.4%, a difference of 0.41%), Cuban (1.4%, a difference of 0.46%), Immigrants from Honduras (1.4%, a difference of 0.47%), and Guyanese (1.4%, a difference of 0.71%).
| Demographics | Rating | Rank | Doctorate Degree |
| Shoshone | 0.1 /100 | #302 | Tragic 1.4% |
| Immigrants | Dominica | 0.1 /100 | #303 | Tragic 1.4% |
| Mexican American Indians | 0.1 /100 | #304 | Tragic 1.4% |
| Pennsylvania Germans | 0.1 /100 | #305 | Tragic 1.4% |
| Guyanese | 0.1 /100 | #306 | Tragic 1.4% |
| Cubans | 0.1 /100 | #307 | Tragic 1.4% |
| Immigrants | Laos | 0.1 /100 | #308 | Tragic 1.4% |
| Immigrants | Grenada | 0.1 /100 | #309 | Tragic 1.4% |
| Immigrants | Jamaica | 0.1 /100 | #310 | Tragic 1.4% |
| Immigrants | Honduras | 0.1 /100 | #311 | Tragic 1.4% |
| Immigrants | Nicaragua | 0.1 /100 | #312 | Tragic 1.4% |
| Menominee | 0.1 /100 | #313 | Tragic 1.4% |
| Dominicans | 0.1 /100 | #314 | Tragic 1.4% |
| Immigrants | Azores | 0.1 /100 | #315 | Tragic 1.4% |
| Navajo | 0.1 /100 | #316 | Tragic 1.4% |