American vs Immigrants from Zaire Doctorate Degree
COMPARE
American
Immigrants from Zaire
Doctorate Degree
Doctorate Degree Comparison
Americans
Immigrants from Zaire
1.5%
DOCTORATE DEGREE
1.0/ 100
METRIC RATING
253rd/ 347
METRIC RANK
2.0%
DOCTORATE DEGREE
91.1/ 100
METRIC RATING
128th/ 347
METRIC RANK
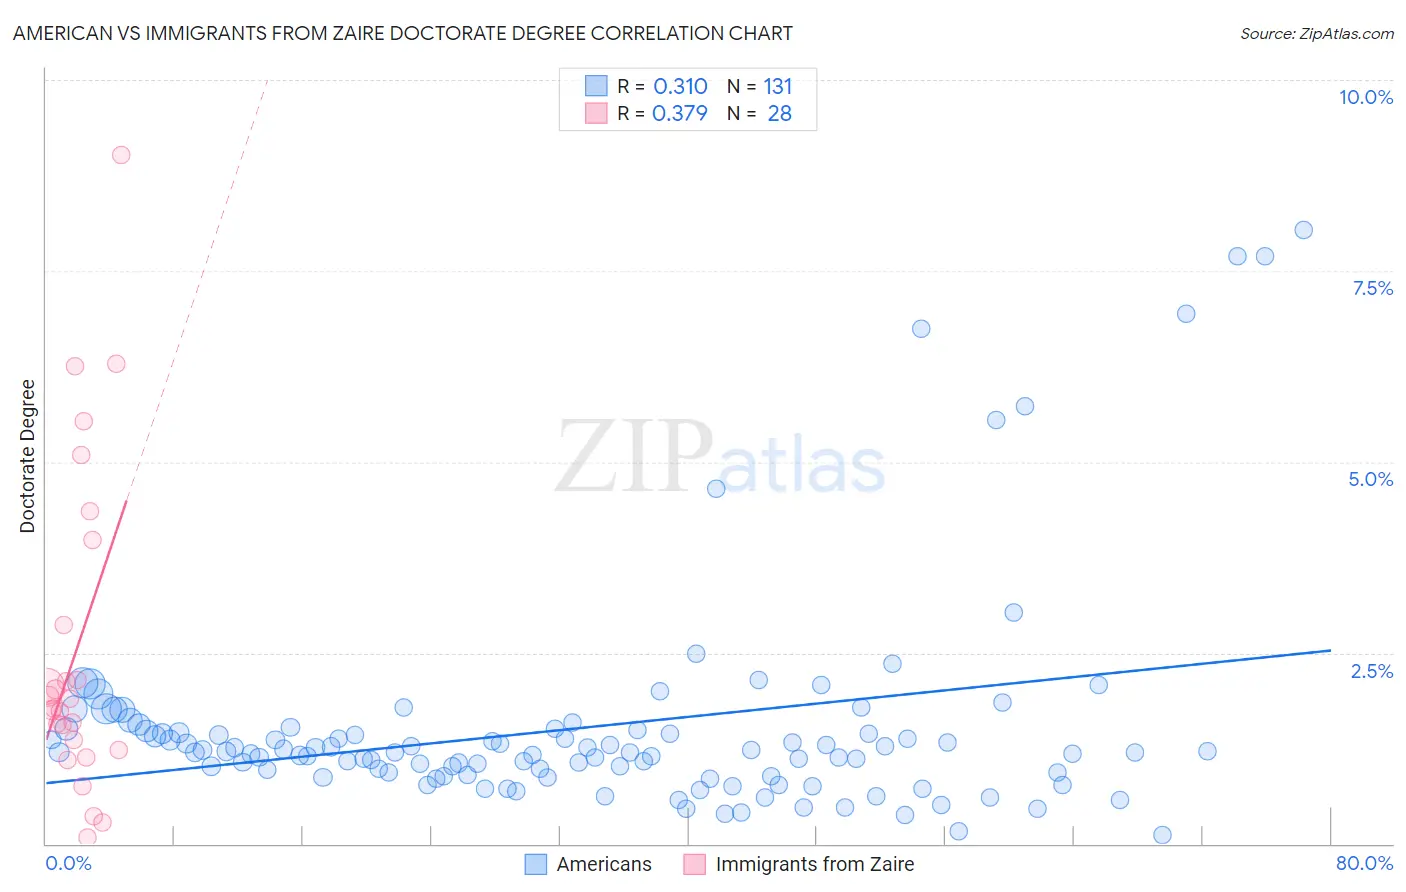
American vs Immigrants from Zaire Doctorate Degree Correlation Chart
The statistical analysis conducted on geographies consisting of 552,800,841 people shows a mild positive correlation between the proportion of Americans and percentage of population with at least doctorate degree education in the United States with a correlation coefficient (R) of 0.310 and weighted average of 1.5%. Similarly, the statistical analysis conducted on geographies consisting of 107,152,130 people shows a mild positive correlation between the proportion of Immigrants from Zaire and percentage of population with at least doctorate degree education in the United States with a correlation coefficient (R) of 0.379 and weighted average of 2.0%, a difference of 30.4%.
Doctorate Degree Correlation Summary
| Measurement | American | Immigrants from Zaire |
| Minimum | 0.12% | 0.076% |
| Maximum | 8.0% | 9.0% |
| Range | 7.9% | 8.9% |
| Mean | 1.5% | 2.6% |
| Median | 1.2% | 1.8% |
| Interquartile 25% (IQ1) | 0.90% | 1.3% |
| Interquartile 75% (IQ3) | 1.5% | 3.4% |
| Interquartile Range (IQR) | 0.58% | 2.1% |
| Standard Deviation (Sample) | 1.4% | 2.1% |
| Standard Deviation (Population) | 1.4% | 2.1% |
Similar Demographics by Doctorate Degree
Demographics Similar to Americans by Doctorate Degree
In terms of doctorate degree, the demographic groups most similar to Americans are Immigrants from Cambodia (1.5%, a difference of 0.13%), Trinidadian and Tobagonian (1.5%, a difference of 0.13%), Yuman (1.5%, a difference of 0.15%), Central American Indian (1.5%, a difference of 0.18%), and Chippewa (1.5%, a difference of 0.40%).
| Demographics | Rating | Rank | Doctorate Degree |
| Hmong | 1.8 /100 | #246 | Tragic 1.6% |
| Comanche | 1.8 /100 | #247 | Tragic 1.6% |
| Africans | 1.8 /100 | #248 | Tragic 1.6% |
| Potawatomi | 1.6 /100 | #249 | Tragic 1.6% |
| Immigrants | Fiji | 1.6 /100 | #250 | Tragic 1.6% |
| Apache | 1.3 /100 | #251 | Tragic 1.5% |
| Yuman | 1.1 /100 | #252 | Tragic 1.5% |
| Americans | 1.0 /100 | #253 | Tragic 1.5% |
| Immigrants | Cambodia | 1.0 /100 | #254 | Tragic 1.5% |
| Trinidadians and Tobagonians | 1.0 /100 | #255 | Tragic 1.5% |
| Central American Indians | 1.0 /100 | #256 | Tragic 1.5% |
| Chippewa | 0.9 /100 | #257 | Tragic 1.5% |
| Immigrants | West Indies | 0.9 /100 | #258 | Tragic 1.5% |
| Liberians | 0.9 /100 | #259 | Tragic 1.5% |
| Japanese | 0.9 /100 | #260 | Tragic 1.5% |
Demographics Similar to Immigrants from Zaire by Doctorate Degree
In terms of doctorate degree, the demographic groups most similar to Immigrants from Zaire are Canadian (2.0%, a difference of 0.22%), Immigrants from Ukraine (2.0%, a difference of 0.22%), Immigrants from Sierra Leone (2.0%, a difference of 0.36%), Palestinian (2.0%, a difference of 0.42%), and Jordanian (2.0%, a difference of 0.46%).
| Demographics | Rating | Rank | Doctorate Degree |
| Immigrants | Jordan | 94.8 /100 | #121 | Exceptional 2.0% |
| Immigrants | Southern Europe | 94.7 /100 | #122 | Exceptional 2.0% |
| Croatians | 94.0 /100 | #123 | Exceptional 2.0% |
| Ute | 93.2 /100 | #124 | Exceptional 2.0% |
| Moroccans | 93.0 /100 | #125 | Exceptional 2.0% |
| Jordanians | 92.1 /100 | #126 | Exceptional 2.0% |
| Palestinians | 92.0 /100 | #127 | Exceptional 2.0% |
| Immigrants | Zaire | 91.1 /100 | #128 | Exceptional 2.0% |
| Canadians | 90.6 /100 | #129 | Exceptional 2.0% |
| Immigrants | Ukraine | 90.5 /100 | #130 | Exceptional 2.0% |
| Immigrants | Sierra Leone | 90.2 /100 | #131 | Exceptional 2.0% |
| Scottish | 89.4 /100 | #132 | Excellent 2.0% |
| Immigrants | Uzbekistan | 89.3 /100 | #133 | Excellent 2.0% |
| Immigrants | Cameroon | 88.9 /100 | #134 | Excellent 2.0% |
| Serbians | 88.7 /100 | #135 | Excellent 2.0% |