American vs Immigrants from Grenada Doctorate Degree
COMPARE
American
Immigrants from Grenada
Doctorate Degree
Doctorate Degree Comparison
Americans
Immigrants from Grenada
1.5%
DOCTORATE DEGREE
1.0/ 100
METRIC RATING
253rd/ 347
METRIC RANK
1.4%
DOCTORATE DEGREE
0.1/ 100
METRIC RATING
309th/ 347
METRIC RANK
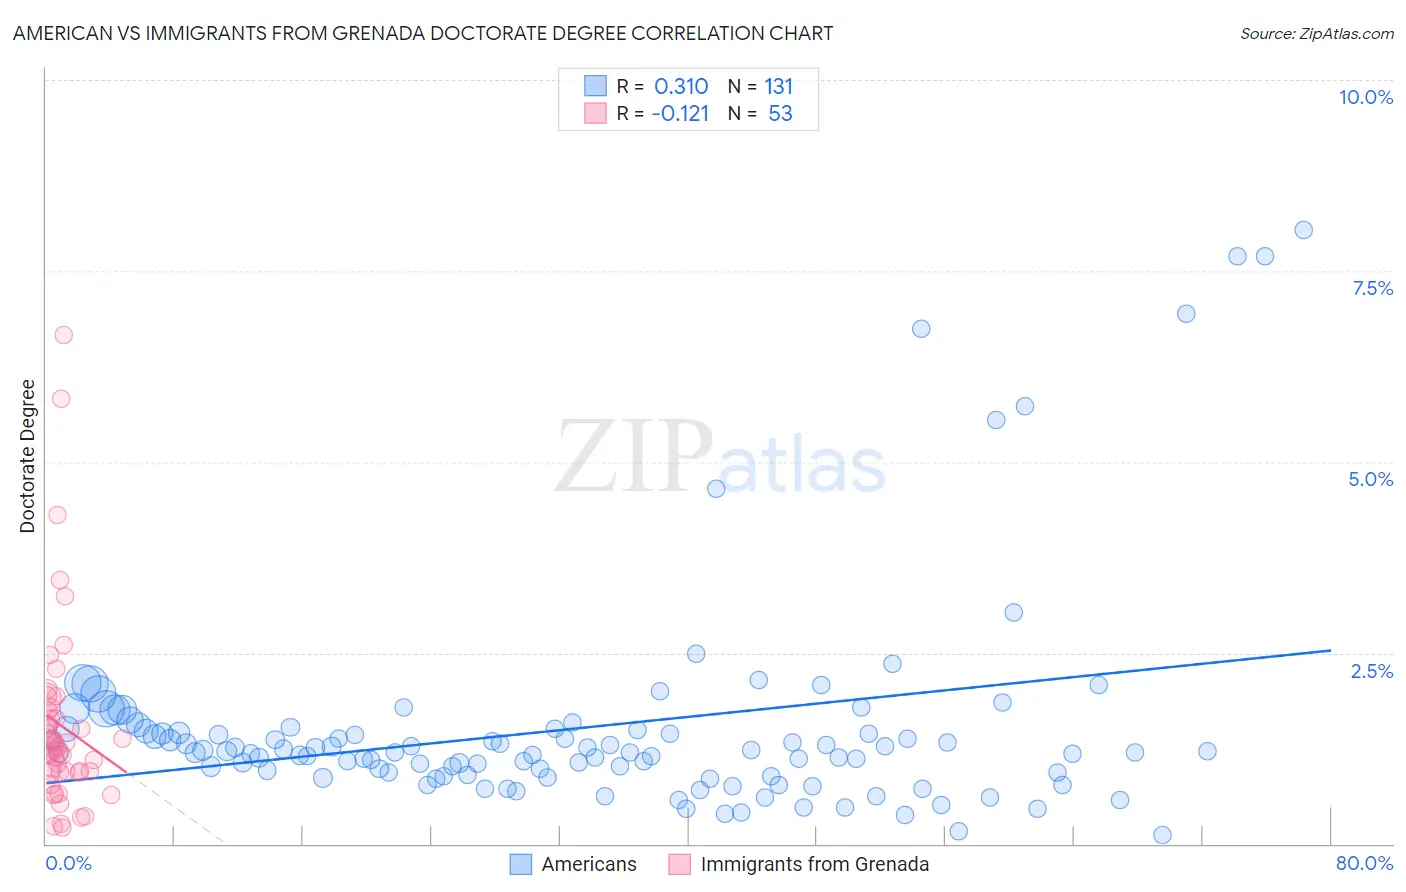
American vs Immigrants from Grenada Doctorate Degree Correlation Chart
The statistical analysis conducted on geographies consisting of 552,800,841 people shows a mild positive correlation between the proportion of Americans and percentage of population with at least doctorate degree education in the United States with a correlation coefficient (R) of 0.310 and weighted average of 1.5%. Similarly, the statistical analysis conducted on geographies consisting of 67,051,362 people shows a poor negative correlation between the proportion of Immigrants from Grenada and percentage of population with at least doctorate degree education in the United States with a correlation coefficient (R) of -0.121 and weighted average of 1.4%, a difference of 11.7%.
Doctorate Degree Correlation Summary
| Measurement | American | Immigrants from Grenada |
| Minimum | 0.12% | 0.22% |
| Maximum | 8.0% | 6.7% |
| Range | 7.9% | 6.4% |
| Mean | 1.5% | 1.5% |
| Median | 1.2% | 1.3% |
| Interquartile 25% (IQ1) | 0.90% | 0.93% |
| Interquartile 75% (IQ3) | 1.5% | 1.8% |
| Interquartile Range (IQR) | 0.58% | 0.83% |
| Standard Deviation (Sample) | 1.4% | 1.2% |
| Standard Deviation (Population) | 1.4% | 1.2% |
Similar Demographics by Doctorate Degree
Demographics Similar to Americans by Doctorate Degree
In terms of doctorate degree, the demographic groups most similar to Americans are Immigrants from Cambodia (1.5%, a difference of 0.13%), Trinidadian and Tobagonian (1.5%, a difference of 0.13%), Yuman (1.5%, a difference of 0.15%), Central American Indian (1.5%, a difference of 0.18%), and Chippewa (1.5%, a difference of 0.40%).
| Demographics | Rating | Rank | Doctorate Degree |
| Hmong | 1.8 /100 | #246 | Tragic 1.6% |
| Comanche | 1.8 /100 | #247 | Tragic 1.6% |
| Africans | 1.8 /100 | #248 | Tragic 1.6% |
| Potawatomi | 1.6 /100 | #249 | Tragic 1.6% |
| Immigrants | Fiji | 1.6 /100 | #250 | Tragic 1.6% |
| Apache | 1.3 /100 | #251 | Tragic 1.5% |
| Yuman | 1.1 /100 | #252 | Tragic 1.5% |
| Americans | 1.0 /100 | #253 | Tragic 1.5% |
| Immigrants | Cambodia | 1.0 /100 | #254 | Tragic 1.5% |
| Trinidadians and Tobagonians | 1.0 /100 | #255 | Tragic 1.5% |
| Central American Indians | 1.0 /100 | #256 | Tragic 1.5% |
| Chippewa | 0.9 /100 | #257 | Tragic 1.5% |
| Immigrants | West Indies | 0.9 /100 | #258 | Tragic 1.5% |
| Liberians | 0.9 /100 | #259 | Tragic 1.5% |
| Japanese | 0.9 /100 | #260 | Tragic 1.5% |
Demographics Similar to Immigrants from Grenada by Doctorate Degree
In terms of doctorate degree, the demographic groups most similar to Immigrants from Grenada are Immigrants from Jamaica (1.4%, a difference of 0.30%), Immigrants from Laos (1.4%, a difference of 0.41%), Cuban (1.4%, a difference of 0.46%), Immigrants from Honduras (1.4%, a difference of 0.47%), and Guyanese (1.4%, a difference of 0.71%).
| Demographics | Rating | Rank | Doctorate Degree |
| Shoshone | 0.1 /100 | #302 | Tragic 1.4% |
| Immigrants | Dominica | 0.1 /100 | #303 | Tragic 1.4% |
| Mexican American Indians | 0.1 /100 | #304 | Tragic 1.4% |
| Pennsylvania Germans | 0.1 /100 | #305 | Tragic 1.4% |
| Guyanese | 0.1 /100 | #306 | Tragic 1.4% |
| Cubans | 0.1 /100 | #307 | Tragic 1.4% |
| Immigrants | Laos | 0.1 /100 | #308 | Tragic 1.4% |
| Immigrants | Grenada | 0.1 /100 | #309 | Tragic 1.4% |
| Immigrants | Jamaica | 0.1 /100 | #310 | Tragic 1.4% |
| Immigrants | Honduras | 0.1 /100 | #311 | Tragic 1.4% |
| Immigrants | Nicaragua | 0.1 /100 | #312 | Tragic 1.4% |
| Menominee | 0.1 /100 | #313 | Tragic 1.4% |
| Dominicans | 0.1 /100 | #314 | Tragic 1.4% |
| Immigrants | Azores | 0.1 /100 | #315 | Tragic 1.4% |
| Navajo | 0.1 /100 | #316 | Tragic 1.4% |