Creek vs Immigrants from Peru 10th Grade
COMPARE
Creek
Immigrants from Peru
10th Grade
10th Grade Comparison
Creek
Immigrants from Peru
94.2%
10TH GRADE
91.9/ 100
METRIC RATING
133rd/ 347
METRIC RANK
92.2%
10TH GRADE
0.1/ 100
METRIC RATING
282nd/ 347
METRIC RANK
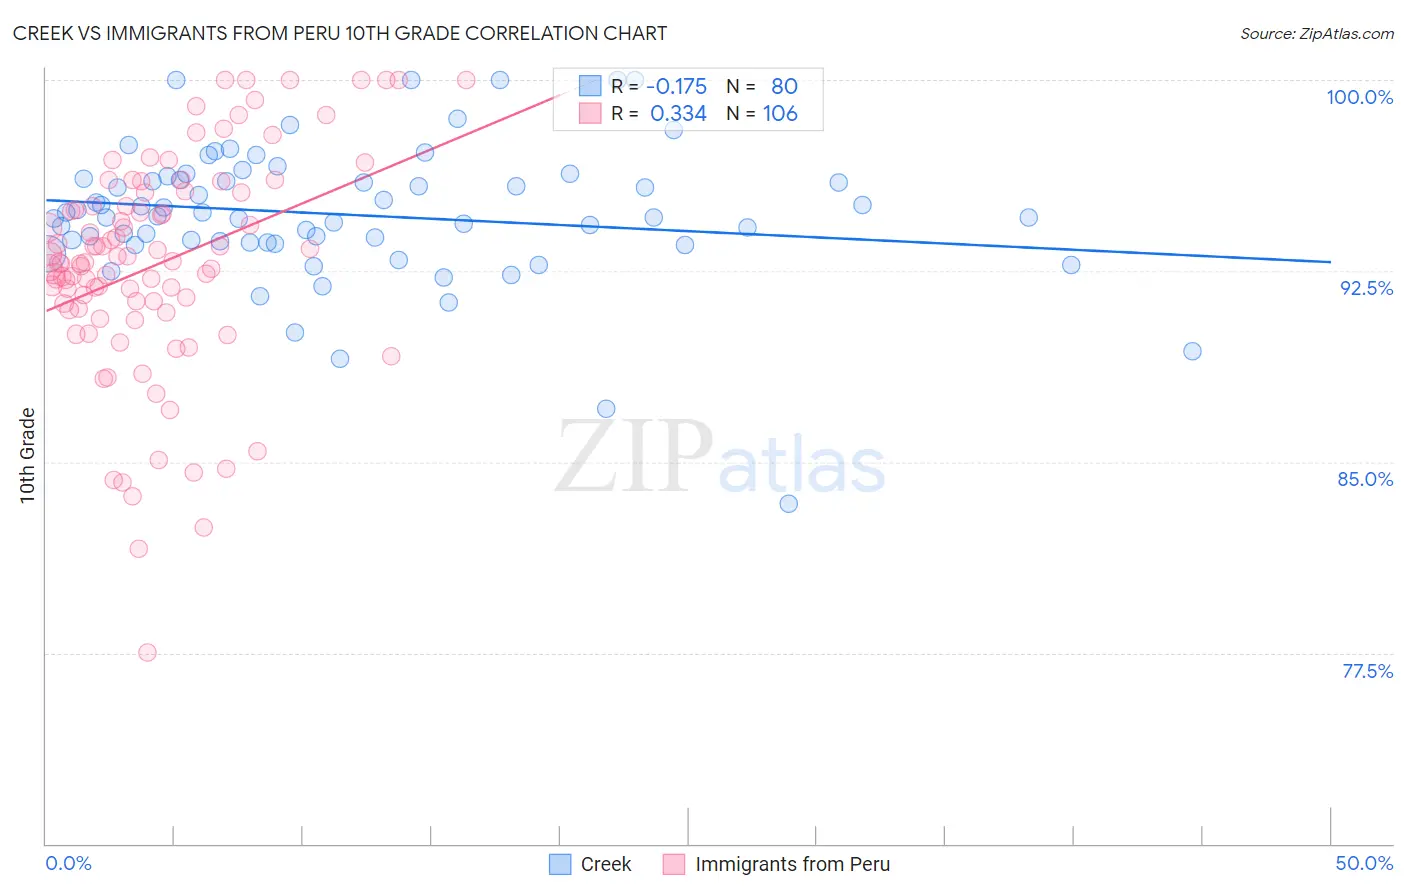
Creek vs Immigrants from Peru 10th Grade Correlation Chart
The statistical analysis conducted on geographies consisting of 178,480,629 people shows a poor negative correlation between the proportion of Creek and percentage of population with at least 10th grade education in the United States with a correlation coefficient (R) of -0.175 and weighted average of 94.2%. Similarly, the statistical analysis conducted on geographies consisting of 328,860,880 people shows a mild positive correlation between the proportion of Immigrants from Peru and percentage of population with at least 10th grade education in the United States with a correlation coefficient (R) of 0.334 and weighted average of 92.2%, a difference of 2.3%.
10th Grade Correlation Summary
| Measurement | Creek | Immigrants from Peru |
| Minimum | 83.3% | 77.5% |
| Maximum | 100.0% | 100.0% |
| Range | 16.7% | 22.5% |
| Mean | 94.7% | 92.8% |
| Median | 94.6% | 92.8% |
| Interquartile 25% (IQ1) | 93.6% | 91.0% |
| Interquartile 75% (IQ3) | 96.1% | 95.6% |
| Interquartile Range (IQR) | 2.5% | 4.6% |
| Standard Deviation (Sample) | 2.7% | 4.3% |
| Standard Deviation (Population) | 2.7% | 4.3% |
Similar Demographics by 10th Grade
Demographics Similar to Creek by 10th Grade
In terms of 10th grade, the demographic groups most similar to Creek are Immigrants from Russia (94.3%, a difference of 0.010%), Osage (94.2%, a difference of 0.010%), Immigrants from Eastern Europe (94.3%, a difference of 0.020%), Immigrants from Korea (94.2%, a difference of 0.020%), and Iroquois (94.3%, a difference of 0.030%).
| Demographics | Rating | Rank | 10th Grade |
| Immigrants | Iran | 94.4 /100 | #126 | Exceptional 94.3% |
| Israelis | 93.8 /100 | #127 | Exceptional 94.3% |
| Potawatomi | 93.6 /100 | #128 | Exceptional 94.3% |
| Iroquois | 92.8 /100 | #129 | Exceptional 94.3% |
| Immigrants | Greece | 92.7 /100 | #130 | Exceptional 94.3% |
| Immigrants | Eastern Europe | 92.5 /100 | #131 | Exceptional 94.3% |
| Immigrants | Russia | 92.4 /100 | #132 | Exceptional 94.3% |
| Creek | 91.9 /100 | #133 | Exceptional 94.2% |
| Osage | 91.7 /100 | #134 | Exceptional 94.2% |
| Immigrants | Korea | 91.3 /100 | #135 | Exceptional 94.2% |
| Shoshone | 90.8 /100 | #136 | Exceptional 94.2% |
| Arapaho | 90.5 /100 | #137 | Exceptional 94.2% |
| Immigrants | Sri Lanka | 89.9 /100 | #138 | Excellent 94.2% |
| Immigrants | Bosnia and Herzegovina | 89.4 /100 | #139 | Excellent 94.2% |
| Immigrants | Jordan | 87.6 /100 | #140 | Excellent 94.1% |
Demographics Similar to Immigrants from Peru by 10th Grade
In terms of 10th grade, the demographic groups most similar to Immigrants from Peru are Bangladeshi (92.2%, a difference of 0.020%), Malaysian (92.2%, a difference of 0.030%), Barbadian (92.2%, a difference of 0.060%), Native/Alaskan (92.2%, a difference of 0.060%), and Immigrants from St. Vincent and the Grenadines (92.1%, a difference of 0.060%).
| Demographics | Rating | Rank | 10th Grade |
| West Indians | 0.2 /100 | #275 | Tragic 92.4% |
| Immigrants | Trinidad and Tobago | 0.1 /100 | #276 | Tragic 92.3% |
| Navajo | 0.1 /100 | #277 | Tragic 92.3% |
| Barbadians | 0.1 /100 | #278 | Tragic 92.2% |
| Natives/Alaskans | 0.1 /100 | #279 | Tragic 92.2% |
| Malaysians | 0.1 /100 | #280 | Tragic 92.2% |
| Bangladeshis | 0.1 /100 | #281 | Tragic 92.2% |
| Immigrants | Peru | 0.1 /100 | #282 | Tragic 92.2% |
| Immigrants | St. Vincent and the Grenadines | 0.0 /100 | #283 | Tragic 92.1% |
| Immigrants | Barbados | 0.0 /100 | #284 | Tragic 92.1% |
| Immigrants | South Eastern Asia | 0.0 /100 | #285 | Tragic 92.1% |
| Yuman | 0.0 /100 | #286 | Tragic 92.0% |
| Pennsylvania Germans | 0.0 /100 | #287 | Tragic 91.9% |
| Immigrants | Laos | 0.0 /100 | #288 | Tragic 91.9% |
| Sri Lankans | 0.0 /100 | #289 | Tragic 91.8% |