Colombian vs Immigrants from Kenya No Schooling Completed
COMPARE
Colombian
Immigrants from Kenya
No Schooling Completed
No Schooling Completed Comparison
Colombians
Immigrants from Kenya
2.3%
NO SCHOOLING COMPLETED
3.2/ 100
METRIC RATING
232nd/ 347
METRIC RANK
2.1%
NO SCHOOLING COMPLETED
36.2/ 100
METRIC RATING
188th/ 347
METRIC RANK
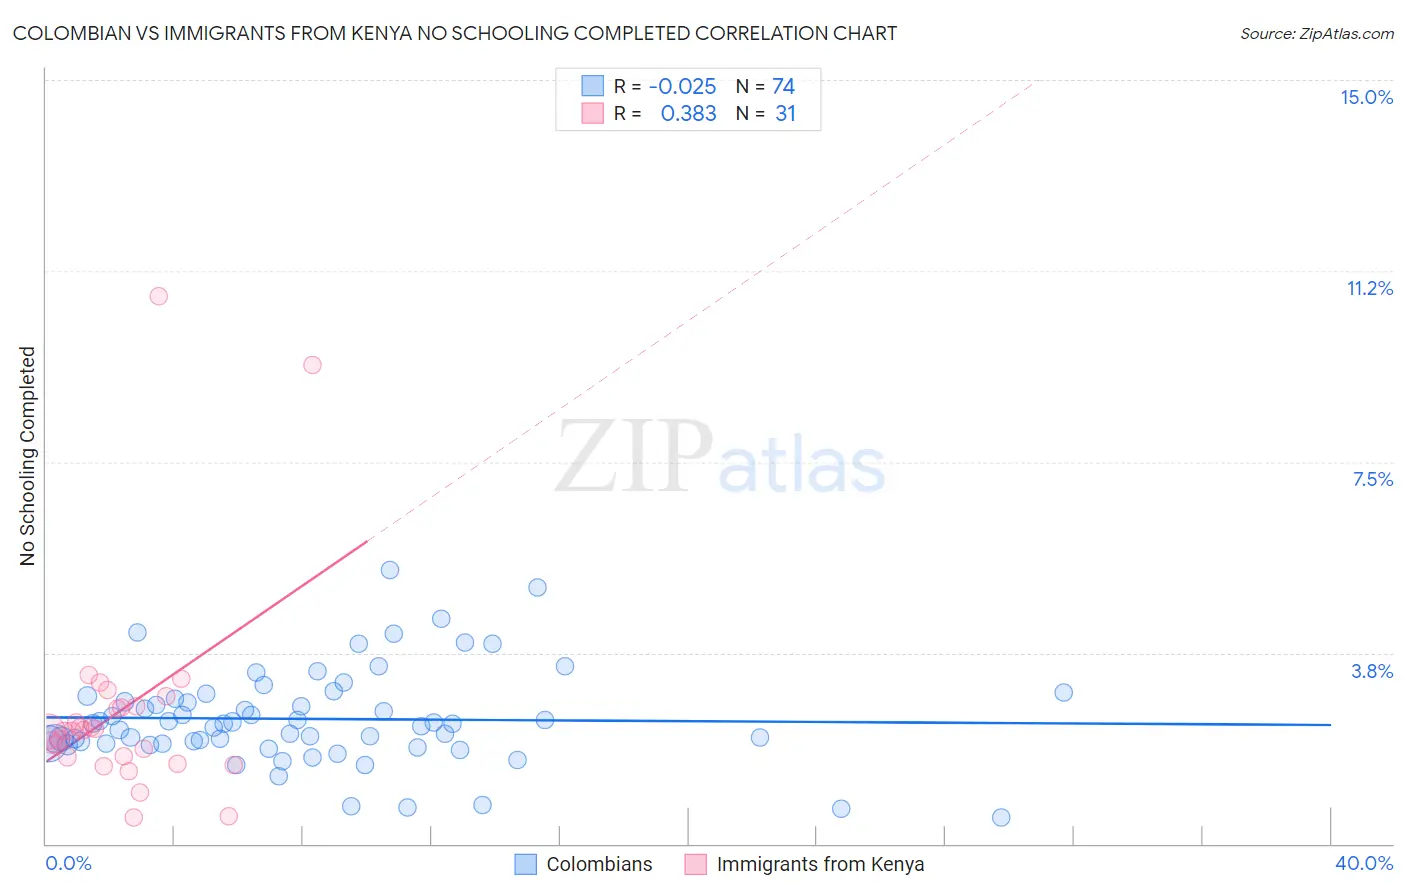
Colombian vs Immigrants from Kenya No Schooling Completed Correlation Chart
The statistical analysis conducted on geographies consisting of 415,449,893 people shows no correlation between the proportion of Colombians and percentage of population with no schooling in the United States with a correlation coefficient (R) of -0.025 and weighted average of 2.3%. Similarly, the statistical analysis conducted on geographies consisting of 217,120,357 people shows a mild positive correlation between the proportion of Immigrants from Kenya and percentage of population with no schooling in the United States with a correlation coefficient (R) of 0.383 and weighted average of 2.1%, a difference of 9.4%.
No Schooling Completed Correlation Summary
| Measurement | Colombian | Immigrants from Kenya |
| Minimum | 0.52% | 0.53% |
| Maximum | 5.4% | 10.7% |
| Range | 4.9% | 10.2% |
| Mean | 2.5% | 2.6% |
| Median | 2.4% | 2.2% |
| Interquartile 25% (IQ1) | 2.0% | 1.7% |
| Interquartile 75% (IQ3) | 2.8% | 2.7% |
| Interquartile Range (IQR) | 0.88% | 0.99% |
| Standard Deviation (Sample) | 0.93% | 2.1% |
| Standard Deviation (Population) | 0.92% | 2.1% |
Similar Demographics by No Schooling Completed
Demographics Similar to Colombians by No Schooling Completed
In terms of no schooling completed, the demographic groups most similar to Colombians are Immigrants from Uruguay (2.3%, a difference of 0.22%), Puerto Rican (2.3%, a difference of 0.25%), Immigrants from Malaysia (2.3%, a difference of 0.36%), Immigrants from Pakistan (2.3%, a difference of 0.38%), and U.S. Virgin Islander (2.3%, a difference of 0.47%).
| Demographics | Rating | Rank | No Schooling Completed |
| Sudanese | 4.1 /100 | #225 | Tragic 2.3% |
| Sierra Leoneans | 4.1 /100 | #226 | Tragic 2.3% |
| Immigrants | Uganda | 4.0 /100 | #227 | Tragic 2.3% |
| U.S. Virgin Islanders | 3.7 /100 | #228 | Tragic 2.3% |
| Immigrants | Pakistan | 3.6 /100 | #229 | Tragic 2.3% |
| Puerto Ricans | 3.4 /100 | #230 | Tragic 2.3% |
| Immigrants | Uruguay | 3.4 /100 | #231 | Tragic 2.3% |
| Colombians | 3.2 /100 | #232 | Tragic 2.3% |
| Immigrants | Malaysia | 2.8 /100 | #233 | Tragic 2.3% |
| Nigerians | 2.6 /100 | #234 | Tragic 2.3% |
| Immigrants | Western Asia | 2.6 /100 | #235 | Tragic 2.3% |
| Iraqis | 2.2 /100 | #236 | Tragic 2.4% |
| Immigrants | Eastern Asia | 2.0 /100 | #237 | Tragic 2.4% |
| Paiute | 1.9 /100 | #238 | Tragic 2.4% |
| Liberians | 1.8 /100 | #239 | Tragic 2.4% |
Demographics Similar to Immigrants from Kenya by No Schooling Completed
In terms of no schooling completed, the demographic groups most similar to Immigrants from Kenya are Immigrants from Egypt (2.1%, a difference of 0.010%), Navajo (2.1%, a difference of 0.050%), Immigrants from Bosnia and Herzegovina (2.1%, a difference of 0.35%), Spanish American (2.1%, a difference of 0.52%), and Mongolian (2.1%, a difference of 0.65%).
| Demographics | Rating | Rank | No Schooling Completed |
| Immigrants | Taiwan | 42.6 /100 | #181 | Average 2.1% |
| French American Indians | 42.2 /100 | #182 | Average 2.1% |
| Blacks/African Americans | 41.4 /100 | #183 | Average 2.1% |
| Pima | 41.3 /100 | #184 | Average 2.1% |
| Mongolians | 40.8 /100 | #185 | Average 2.1% |
| Immigrants | Bosnia and Herzegovina | 38.6 /100 | #186 | Fair 2.1% |
| Navajo | 36.5 /100 | #187 | Fair 2.1% |
| Immigrants | Kenya | 36.2 /100 | #188 | Fair 2.1% |
| Immigrants | Egypt | 36.1 /100 | #189 | Fair 2.1% |
| Spanish Americans | 32.6 /100 | #190 | Fair 2.1% |
| Bermudans | 30.7 /100 | #191 | Fair 2.1% |
| Guamanians/Chamorros | 29.8 /100 | #192 | Fair 2.2% |
| Paraguayans | 29.3 /100 | #193 | Fair 2.2% |
| Immigrants | Albania | 28.3 /100 | #194 | Fair 2.2% |
| Hawaiians | 27.0 /100 | #195 | Fair 2.2% |