Colombian vs Immigrants from Japan No Schooling Completed
COMPARE
Colombian
Immigrants from Japan
No Schooling Completed
No Schooling Completed Comparison
Colombians
Immigrants from Japan
2.3%
NO SCHOOLING COMPLETED
3.2/ 100
METRIC RATING
232nd/ 347
METRIC RANK
1.9%
NO SCHOOLING COMPLETED
96.6/ 100
METRIC RATING
111th/ 347
METRIC RANK
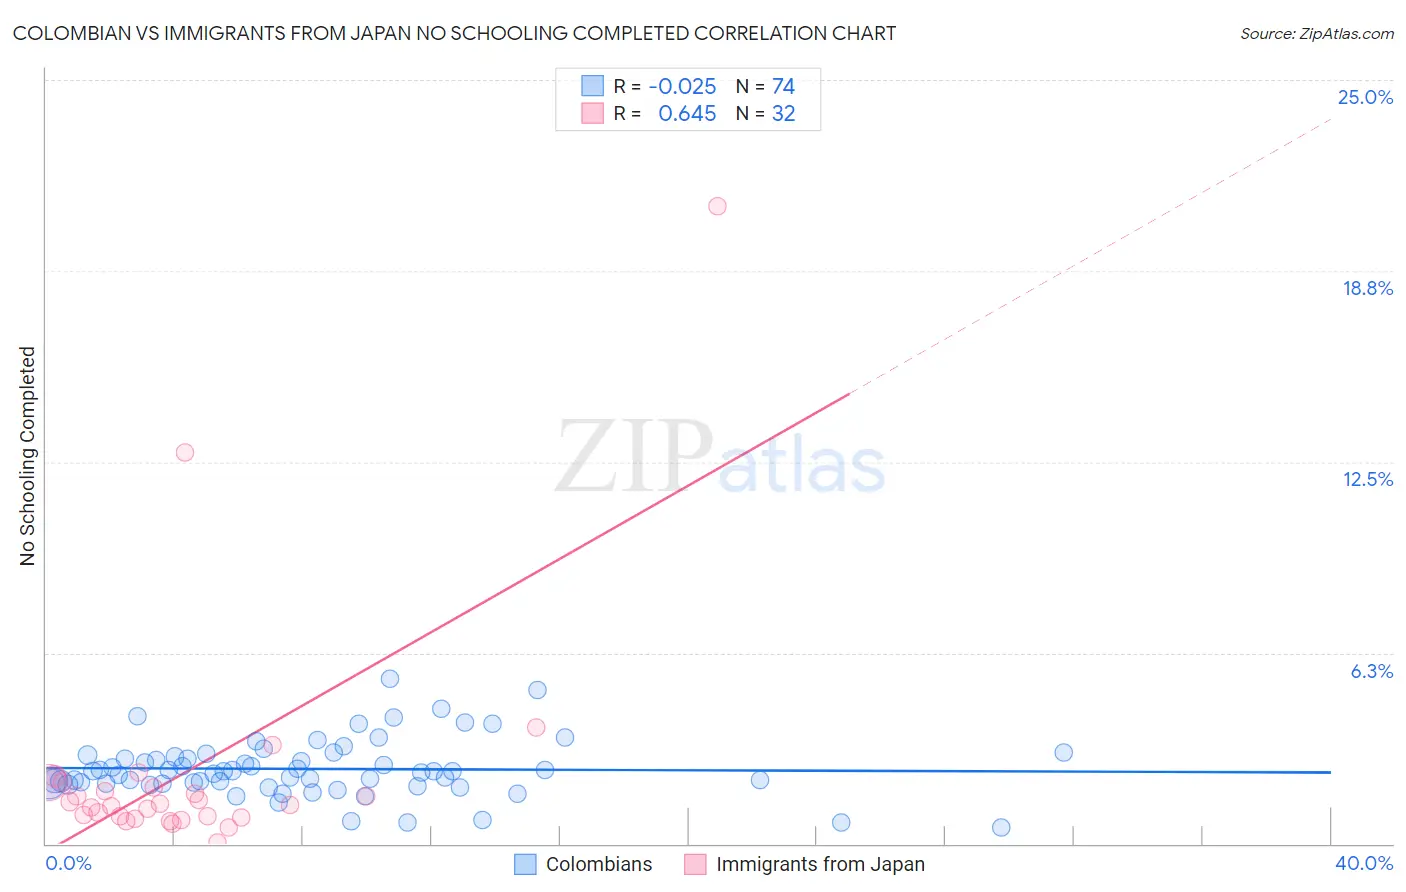
Colombian vs Immigrants from Japan No Schooling Completed Correlation Chart
The statistical analysis conducted on geographies consisting of 415,449,893 people shows no correlation between the proportion of Colombians and percentage of population with no schooling in the United States with a correlation coefficient (R) of -0.025 and weighted average of 2.3%. Similarly, the statistical analysis conducted on geographies consisting of 337,168,238 people shows a significant positive correlation between the proportion of Immigrants from Japan and percentage of population with no schooling in the United States with a correlation coefficient (R) of 0.645 and weighted average of 1.9%, a difference of 25.5%.
No Schooling Completed Correlation Summary
| Measurement | Colombian | Immigrants from Japan |
| Minimum | 0.52% | 0.022% |
| Maximum | 5.4% | 20.9% |
| Range | 4.9% | 20.9% |
| Mean | 2.5% | 2.4% |
| Median | 2.4% | 1.3% |
| Interquartile 25% (IQ1) | 2.0% | 0.88% |
| Interquartile 75% (IQ3) | 2.8% | 1.9% |
| Interquartile Range (IQR) | 0.88% | 1.0% |
| Standard Deviation (Sample) | 0.93% | 4.0% |
| Standard Deviation (Population) | 0.92% | 3.9% |
Similar Demographics by No Schooling Completed
Demographics Similar to Colombians by No Schooling Completed
In terms of no schooling completed, the demographic groups most similar to Colombians are Immigrants from Uruguay (2.3%, a difference of 0.22%), Puerto Rican (2.3%, a difference of 0.25%), Immigrants from Malaysia (2.3%, a difference of 0.36%), Immigrants from Pakistan (2.3%, a difference of 0.38%), and U.S. Virgin Islander (2.3%, a difference of 0.47%).
| Demographics | Rating | Rank | No Schooling Completed |
| Sudanese | 4.1 /100 | #225 | Tragic 2.3% |
| Sierra Leoneans | 4.1 /100 | #226 | Tragic 2.3% |
| Immigrants | Uganda | 4.0 /100 | #227 | Tragic 2.3% |
| U.S. Virgin Islanders | 3.7 /100 | #228 | Tragic 2.3% |
| Immigrants | Pakistan | 3.6 /100 | #229 | Tragic 2.3% |
| Puerto Ricans | 3.4 /100 | #230 | Tragic 2.3% |
| Immigrants | Uruguay | 3.4 /100 | #231 | Tragic 2.3% |
| Colombians | 3.2 /100 | #232 | Tragic 2.3% |
| Immigrants | Malaysia | 2.8 /100 | #233 | Tragic 2.3% |
| Nigerians | 2.6 /100 | #234 | Tragic 2.3% |
| Immigrants | Western Asia | 2.6 /100 | #235 | Tragic 2.3% |
| Iraqis | 2.2 /100 | #236 | Tragic 2.4% |
| Immigrants | Eastern Asia | 2.0 /100 | #237 | Tragic 2.4% |
| Paiute | 1.9 /100 | #238 | Tragic 2.4% |
| Liberians | 1.8 /100 | #239 | Tragic 2.4% |
Demographics Similar to Immigrants from Japan by No Schooling Completed
In terms of no schooling completed, the demographic groups most similar to Immigrants from Japan are Immigrants from Latvia (1.9%, a difference of 0.15%), Pueblo (1.9%, a difference of 0.19%), Immigrants from Saudi Arabia (1.9%, a difference of 0.28%), Immigrants from Zimbabwe (1.9%, a difference of 0.43%), and Immigrants from Norway (1.9%, a difference of 0.44%).
| Demographics | Rating | Rank | No Schooling Completed |
| Thais | 97.5 /100 | #104 | Exceptional 1.8% |
| German Russians | 97.5 /100 | #105 | Exceptional 1.8% |
| Immigrants | France | 97.3 /100 | #106 | Exceptional 1.8% |
| Yugoslavians | 97.2 /100 | #107 | Exceptional 1.8% |
| Okinawans | 97.1 /100 | #108 | Exceptional 1.8% |
| Immigrants | Saudi Arabia | 96.8 /100 | #109 | Exceptional 1.9% |
| Immigrants | Latvia | 96.7 /100 | #110 | Exceptional 1.9% |
| Immigrants | Japan | 96.6 /100 | #111 | Exceptional 1.9% |
| Pueblo | 96.4 /100 | #112 | Exceptional 1.9% |
| Immigrants | Zimbabwe | 96.2 /100 | #113 | Exceptional 1.9% |
| Immigrants | Norway | 96.1 /100 | #114 | Exceptional 1.9% |
| Syrians | 96.0 /100 | #115 | Exceptional 1.9% |
| Lebanese | 96.0 /100 | #116 | Exceptional 1.9% |
| Immigrants | Serbia | 95.8 /100 | #117 | Exceptional 1.9% |
| Spanish | 95.5 /100 | #118 | Exceptional 1.9% |