Houma vs Immigrants from Kenya No Schooling Completed
COMPARE
Houma
Immigrants from Kenya
No Schooling Completed
No Schooling Completed Comparison
Houma
Immigrants from Kenya
2.8%
NO SCHOOLING COMPLETED
0.0/ 100
METRIC RATING
295th/ 347
METRIC RANK
2.1%
NO SCHOOLING COMPLETED
36.2/ 100
METRIC RATING
188th/ 347
METRIC RANK
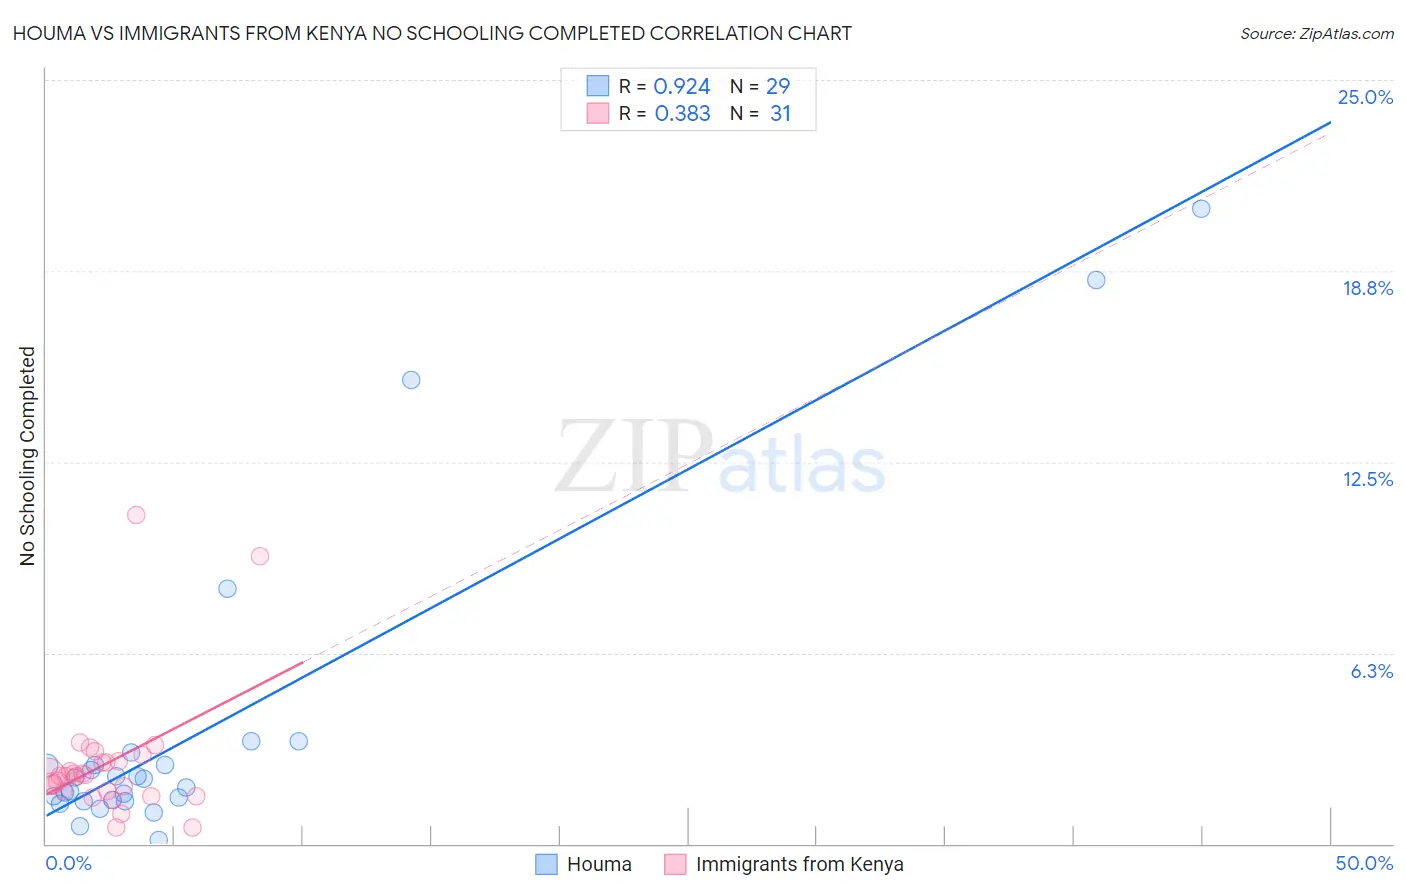
Houma vs Immigrants from Kenya No Schooling Completed Correlation Chart
The statistical analysis conducted on geographies consisting of 36,712,306 people shows a near-perfect positive correlation between the proportion of Houma and percentage of population with no schooling in the United States with a correlation coefficient (R) of 0.924 and weighted average of 2.8%. Similarly, the statistical analysis conducted on geographies consisting of 217,120,357 people shows a mild positive correlation between the proportion of Immigrants from Kenya and percentage of population with no schooling in the United States with a correlation coefficient (R) of 0.383 and weighted average of 2.1%, a difference of 30.7%.
No Schooling Completed Correlation Summary
| Measurement | Houma | Immigrants from Kenya |
| Minimum | 0.12% | 0.53% |
| Maximum | 20.8% | 10.7% |
| Range | 20.7% | 10.2% |
| Mean | 3.8% | 2.6% |
| Median | 2.1% | 2.2% |
| Interquartile 25% (IQ1) | 1.4% | 1.7% |
| Interquartile 75% (IQ3) | 2.8% | 2.7% |
| Interquartile Range (IQR) | 1.4% | 0.99% |
| Standard Deviation (Sample) | 5.2% | 2.1% |
| Standard Deviation (Population) | 5.1% | 2.1% |
Similar Demographics by No Schooling Completed
Demographics Similar to Houma by No Schooling Completed
In terms of no schooling completed, the demographic groups most similar to Houma are Immigrants (2.8%, a difference of 0.10%), Immigrants from Eritrea (2.8%, a difference of 0.52%), Malaysian (2.8%, a difference of 0.69%), Immigrants from Grenada (2.8%, a difference of 1.1%), and Immigrants from Cuba (2.8%, a difference of 1.3%).
| Demographics | Rating | Rank | No Schooling Completed |
| Immigrants | St. Vincent and the Grenadines | 0.0 /100 | #288 | Tragic 2.7% |
| Immigrants | Thailand | 0.0 /100 | #289 | Tragic 2.7% |
| Immigrants | Hong Kong | 0.0 /100 | #290 | Tragic 2.7% |
| British West Indians | 0.0 /100 | #291 | Tragic 2.7% |
| Immigrants | Grenada | 0.0 /100 | #292 | Tragic 2.8% |
| Malaysians | 0.0 /100 | #293 | Tragic 2.8% |
| Immigrants | Eritrea | 0.0 /100 | #294 | Tragic 2.8% |
| Houma | 0.0 /100 | #295 | Tragic 2.8% |
| Immigrants | Immigrants | 0.0 /100 | #296 | Tragic 2.8% |
| Immigrants | Cuba | 0.0 /100 | #297 | Tragic 2.8% |
| Immigrants | Dominica | 0.0 /100 | #298 | Tragic 2.8% |
| Central American Indians | 0.0 /100 | #299 | Tragic 2.8% |
| Haitians | 0.0 /100 | #300 | Tragic 2.9% |
| Immigrants | South Eastern Asia | 0.0 /100 | #301 | Tragic 2.9% |
| Immigrants | Caribbean | 0.0 /100 | #302 | Tragic 2.9% |
Demographics Similar to Immigrants from Kenya by No Schooling Completed
In terms of no schooling completed, the demographic groups most similar to Immigrants from Kenya are Immigrants from Egypt (2.1%, a difference of 0.010%), Navajo (2.1%, a difference of 0.050%), Immigrants from Bosnia and Herzegovina (2.1%, a difference of 0.35%), Spanish American (2.1%, a difference of 0.52%), and Mongolian (2.1%, a difference of 0.65%).
| Demographics | Rating | Rank | No Schooling Completed |
| Immigrants | Taiwan | 42.6 /100 | #181 | Average 2.1% |
| French American Indians | 42.2 /100 | #182 | Average 2.1% |
| Blacks/African Americans | 41.4 /100 | #183 | Average 2.1% |
| Pima | 41.3 /100 | #184 | Average 2.1% |
| Mongolians | 40.8 /100 | #185 | Average 2.1% |
| Immigrants | Bosnia and Herzegovina | 38.6 /100 | #186 | Fair 2.1% |
| Navajo | 36.5 /100 | #187 | Fair 2.1% |
| Immigrants | Kenya | 36.2 /100 | #188 | Fair 2.1% |
| Immigrants | Egypt | 36.1 /100 | #189 | Fair 2.1% |
| Spanish Americans | 32.6 /100 | #190 | Fair 2.1% |
| Bermudans | 30.7 /100 | #191 | Fair 2.1% |
| Guamanians/Chamorros | 29.8 /100 | #192 | Fair 2.2% |
| Paraguayans | 29.3 /100 | #193 | Fair 2.2% |
| Immigrants | Albania | 28.3 /100 | #194 | Fair 2.2% |
| Hawaiians | 27.0 /100 | #195 | Fair 2.2% |