Chinese vs Immigrants from Belgium Professional Degree
COMPARE
Chinese
Immigrants from Belgium
Professional Degree
Professional Degree Comparison
Chinese
Immigrants from Belgium
4.5%
PROFESSIONAL DEGREE
58.6/ 100
METRIC RATING
169th/ 347
METRIC RANK
7.0%
PROFESSIONAL DEGREE
100.0/ 100
METRIC RATING
10th/ 347
METRIC RANK
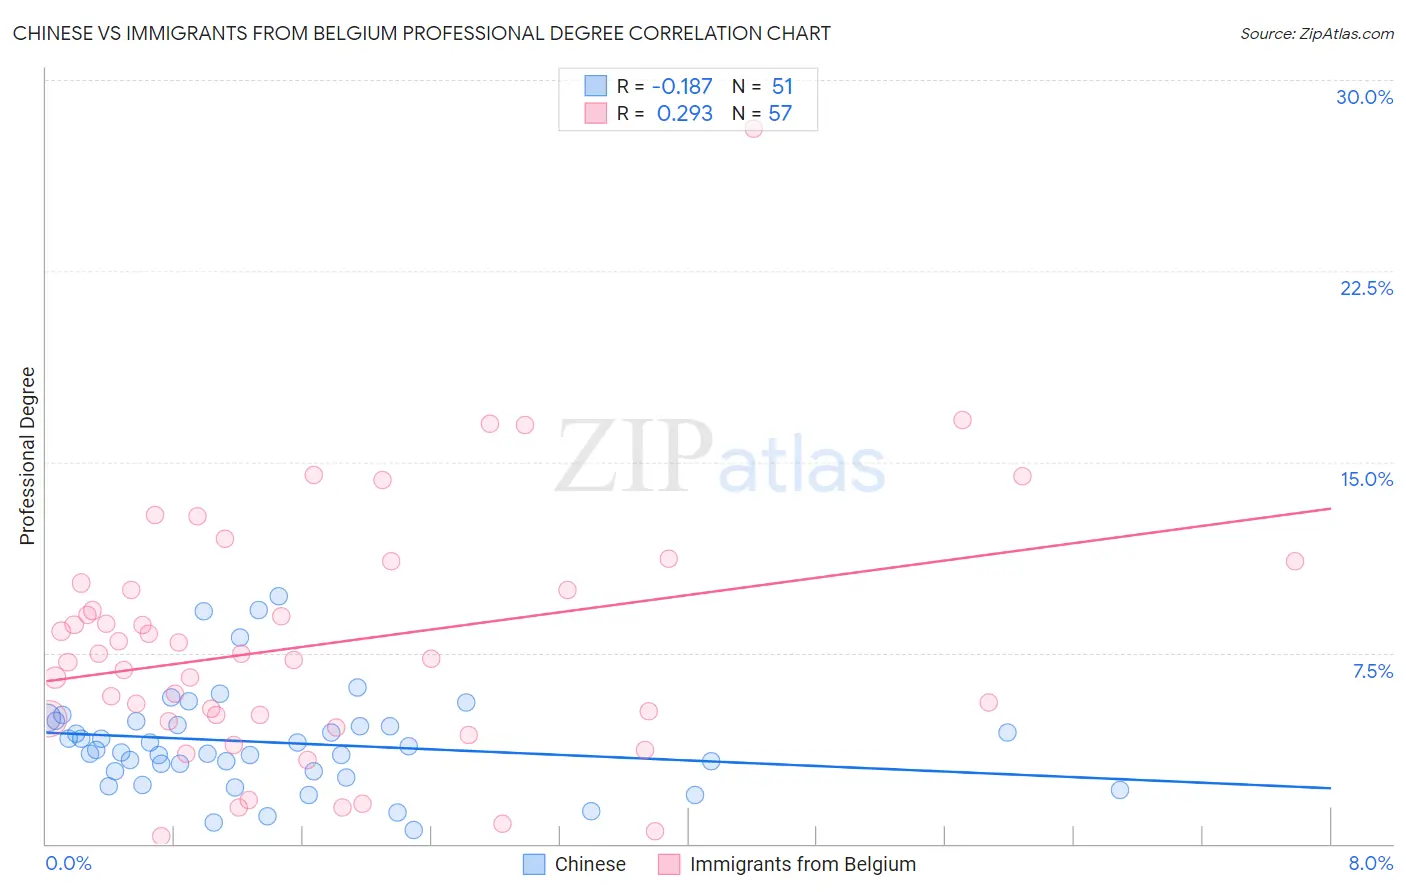
Chinese vs Immigrants from Belgium Professional Degree Correlation Chart
The statistical analysis conducted on geographies consisting of 64,749,783 people shows a poor negative correlation between the proportion of Chinese and percentage of population with at least professional degree education in the United States with a correlation coefficient (R) of -0.187 and weighted average of 4.5%. Similarly, the statistical analysis conducted on geographies consisting of 146,639,976 people shows a weak positive correlation between the proportion of Immigrants from Belgium and percentage of population with at least professional degree education in the United States with a correlation coefficient (R) of 0.293 and weighted average of 7.0%, a difference of 55.7%.
Professional Degree Correlation Summary
| Measurement | Chinese | Immigrants from Belgium |
| Minimum | 0.52% | 0.30% |
| Maximum | 9.7% | 28.1% |
| Range | 9.2% | 27.8% |
| Mean | 4.0% | 7.9% |
| Median | 3.7% | 7.3% |
| Interquartile 25% (IQ1) | 2.8% | 4.9% |
| Interquartile 75% (IQ3) | 4.8% | 10.1% |
| Interquartile Range (IQR) | 2.0% | 5.2% |
| Standard Deviation (Sample) | 2.0% | 5.0% |
| Standard Deviation (Population) | 2.0% | 4.9% |
Similar Demographics by Professional Degree
Demographics Similar to Chinese by Professional Degree
In terms of professional degree, the demographic groups most similar to Chinese are Immigrants from Sierra Leone (4.5%, a difference of 0.020%), Immigrants from Afghanistan (4.5%, a difference of 0.080%), Immigrants from Colombia (4.5%, a difference of 0.11%), Immigrants from Zaire (4.5%, a difference of 0.18%), and Costa Rican (4.5%, a difference of 0.19%).
| Demographics | Rating | Rank | Professional Degree |
| Peruvians | 65.2 /100 | #162 | Good 4.5% |
| Sierra Leoneans | 64.3 /100 | #163 | Good 4.5% |
| Swiss | 61.0 /100 | #164 | Good 4.5% |
| Costa Ricans | 59.9 /100 | #165 | Average 4.5% |
| Immigrants | Colombia | 59.4 /100 | #166 | Average 4.5% |
| Immigrants | Afghanistan | 59.2 /100 | #167 | Average 4.5% |
| Immigrants | Sierra Leone | 58.7 /100 | #168 | Average 4.5% |
| Chinese | 58.6 /100 | #169 | Average 4.5% |
| Immigrants | Zaire | 57.4 /100 | #170 | Average 4.5% |
| Immigrants | Bangladesh | 56.0 /100 | #171 | Average 4.4% |
| Spaniards | 52.0 /100 | #172 | Average 4.4% |
| English | 50.1 /100 | #173 | Average 4.4% |
| Kenyans | 50.0 /100 | #174 | Average 4.4% |
| Irish | 50.0 /100 | #175 | Average 4.4% |
| Immigrants | Peru | 49.3 /100 | #176 | Average 4.4% |
Demographics Similar to Immigrants from Belgium by Professional Degree
In terms of professional degree, the demographic groups most similar to Immigrants from Belgium are Cypriot (6.9%, a difference of 0.17%), Israeli (6.9%, a difference of 0.24%), Immigrants from Australia (6.9%, a difference of 0.66%), Immigrants from Taiwan (7.1%, a difference of 1.7%), and Immigrants from Switzerland (7.1%, a difference of 1.9%).
| Demographics | Rating | Rank | Professional Degree |
| Iranians | 100.0 /100 | #3 | Exceptional 7.6% |
| Filipinos | 100.0 /100 | #4 | Exceptional 7.6% |
| Immigrants | Iran | 100.0 /100 | #5 | Exceptional 7.3% |
| Okinawans | 100.0 /100 | #6 | Exceptional 7.3% |
| Eastern Europeans | 100.0 /100 | #7 | Exceptional 7.1% |
| Immigrants | Switzerland | 100.0 /100 | #8 | Exceptional 7.1% |
| Immigrants | Taiwan | 100.0 /100 | #9 | Exceptional 7.1% |
| Immigrants | Belgium | 100.0 /100 | #10 | Exceptional 7.0% |
| Cypriots | 100.0 /100 | #11 | Exceptional 6.9% |
| Israelis | 100.0 /100 | #12 | Exceptional 6.9% |
| Immigrants | Australia | 100.0 /100 | #13 | Exceptional 6.9% |
| Immigrants | France | 100.0 /100 | #14 | Exceptional 6.8% |
| Immigrants | China | 100.0 /100 | #15 | Exceptional 6.7% |
| Immigrants | Sweden | 100.0 /100 | #16 | Exceptional 6.7% |
| Immigrants | Eastern Asia | 100.0 /100 | #17 | Exceptional 6.6% |