Chinese vs Dutch Professional Degree
COMPARE
Chinese
Dutch
Professional Degree
Professional Degree Comparison
Chinese
Dutch
4.5%
PROFESSIONAL DEGREE
58.6/ 100
METRIC RATING
169th/ 347
METRIC RANK
4.0%
PROFESSIONAL DEGREE
9.0/ 100
METRIC RATING
218th/ 347
METRIC RANK
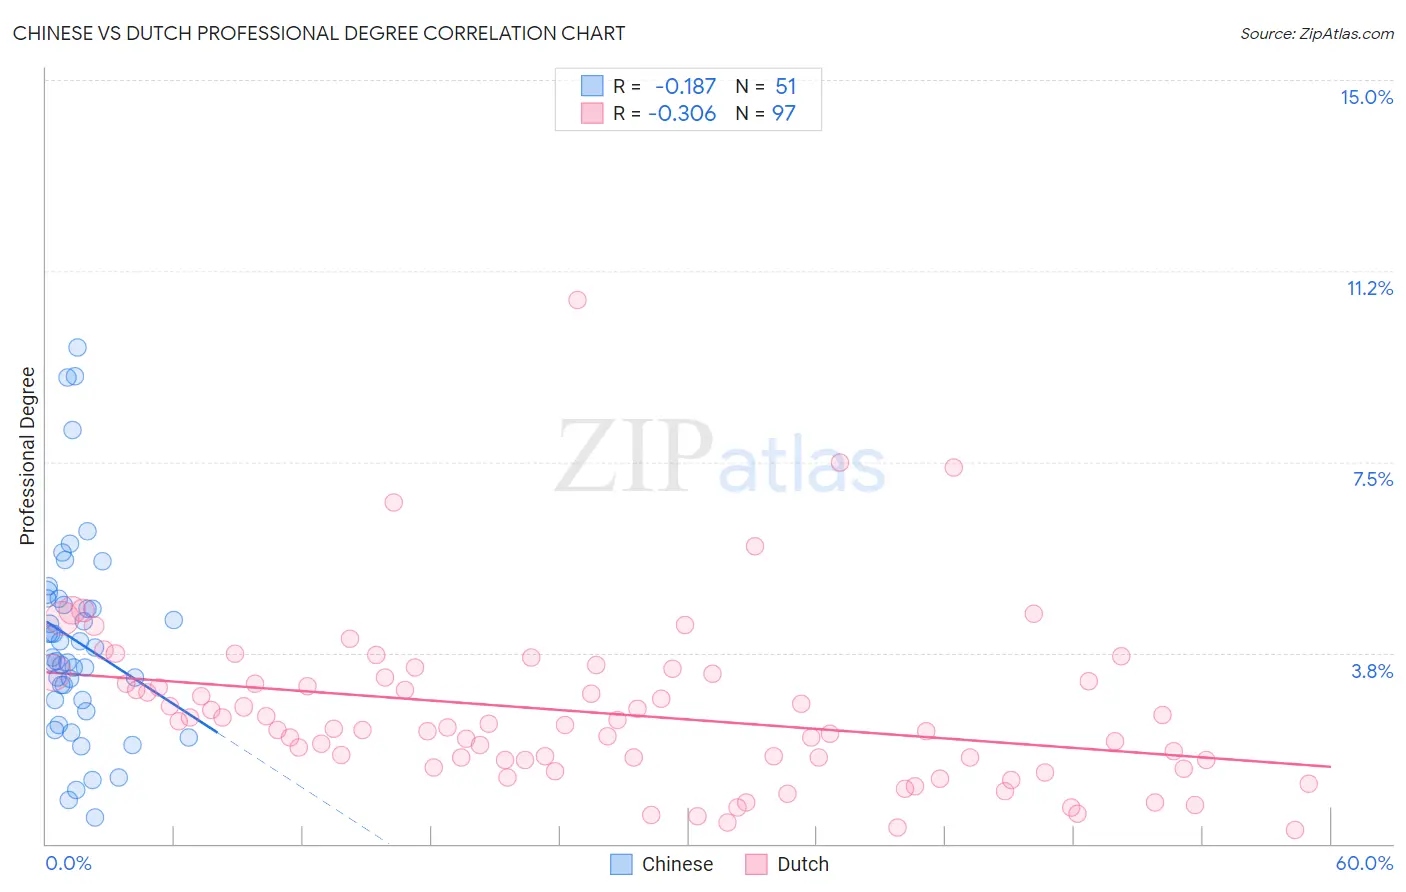
Chinese vs Dutch Professional Degree Correlation Chart
The statistical analysis conducted on geographies consisting of 64,749,783 people shows a poor negative correlation between the proportion of Chinese and percentage of population with at least professional degree education in the United States with a correlation coefficient (R) of -0.187 and weighted average of 4.5%. Similarly, the statistical analysis conducted on geographies consisting of 547,430,412 people shows a mild negative correlation between the proportion of Dutch and percentage of population with at least professional degree education in the United States with a correlation coefficient (R) of -0.306 and weighted average of 4.0%, a difference of 10.6%.
Professional Degree Correlation Summary
| Measurement | Chinese | Dutch |
| Minimum | 0.52% | 0.26% |
| Maximum | 9.7% | 10.7% |
| Range | 9.2% | 10.4% |
| Mean | 4.0% | 2.6% |
| Median | 3.7% | 2.3% |
| Interquartile 25% (IQ1) | 2.8% | 1.6% |
| Interquartile 75% (IQ3) | 4.8% | 3.2% |
| Interquartile Range (IQR) | 2.0% | 1.6% |
| Standard Deviation (Sample) | 2.0% | 1.6% |
| Standard Deviation (Population) | 2.0% | 1.6% |
Similar Demographics by Professional Degree
Demographics Similar to Chinese by Professional Degree
In terms of professional degree, the demographic groups most similar to Chinese are Immigrants from Sierra Leone (4.5%, a difference of 0.020%), Immigrants from Afghanistan (4.5%, a difference of 0.080%), Immigrants from Colombia (4.5%, a difference of 0.11%), Immigrants from Zaire (4.5%, a difference of 0.18%), and Costa Rican (4.5%, a difference of 0.19%).
| Demographics | Rating | Rank | Professional Degree |
| Peruvians | 65.2 /100 | #162 | Good 4.5% |
| Sierra Leoneans | 64.3 /100 | #163 | Good 4.5% |
| Swiss | 61.0 /100 | #164 | Good 4.5% |
| Costa Ricans | 59.9 /100 | #165 | Average 4.5% |
| Immigrants | Colombia | 59.4 /100 | #166 | Average 4.5% |
| Immigrants | Afghanistan | 59.2 /100 | #167 | Average 4.5% |
| Immigrants | Sierra Leone | 58.7 /100 | #168 | Average 4.5% |
| Chinese | 58.6 /100 | #169 | Average 4.5% |
| Immigrants | Zaire | 57.4 /100 | #170 | Average 4.5% |
| Immigrants | Bangladesh | 56.0 /100 | #171 | Average 4.4% |
| Spaniards | 52.0 /100 | #172 | Average 4.4% |
| English | 50.1 /100 | #173 | Average 4.4% |
| Kenyans | 50.0 /100 | #174 | Average 4.4% |
| Irish | 50.0 /100 | #175 | Average 4.4% |
| Immigrants | Peru | 49.3 /100 | #176 | Average 4.4% |
Demographics Similar to Dutch by Professional Degree
In terms of professional degree, the demographic groups most similar to Dutch are Immigrants from South Eastern Asia (4.0%, a difference of 0.030%), Immigrants from Vietnam (4.0%, a difference of 0.21%), West Indian (4.1%, a difference of 0.37%), Ute (4.0%, a difference of 0.39%), and French Canadian (4.0%, a difference of 0.52%).
| Demographics | Rating | Rank | Professional Degree |
| Germans | 11.6 /100 | #211 | Poor 4.1% |
| Whites/Caucasians | 11.2 /100 | #212 | Poor 4.1% |
| Koreans | 10.7 /100 | #213 | Poor 4.1% |
| Immigrants | Ghana | 10.6 /100 | #214 | Poor 4.1% |
| Portuguese | 10.5 /100 | #215 | Poor 4.1% |
| West Indians | 9.8 /100 | #216 | Tragic 4.1% |
| Immigrants | Vietnam | 9.4 /100 | #217 | Tragic 4.0% |
| Dutch | 9.0 /100 | #218 | Tragic 4.0% |
| Immigrants | South Eastern Asia | 8.9 /100 | #219 | Tragic 4.0% |
| Ute | 8.2 /100 | #220 | Tragic 4.0% |
| French Canadians | 8.0 /100 | #221 | Tragic 4.0% |
| Immigrants | Western Africa | 7.5 /100 | #222 | Tragic 4.0% |
| Immigrants | Bosnia and Herzegovina | 7.4 /100 | #223 | Tragic 4.0% |
| Trinidadians and Tobagonians | 7.1 /100 | #224 | Tragic 4.0% |
| Tlingit-Haida | 6.9 /100 | #225 | Tragic 4.0% |