Immigrants from Turkey vs Immigrants from Belgium Professional Degree
COMPARE
Immigrants from Turkey
Immigrants from Belgium
Professional Degree
Professional Degree Comparison
Immigrants from Turkey
Immigrants from Belgium
6.2%
PROFESSIONAL DEGREE
100.0/ 100
METRIC RATING
30th/ 347
METRIC RANK
7.0%
PROFESSIONAL DEGREE
100.0/ 100
METRIC RATING
10th/ 347
METRIC RANK
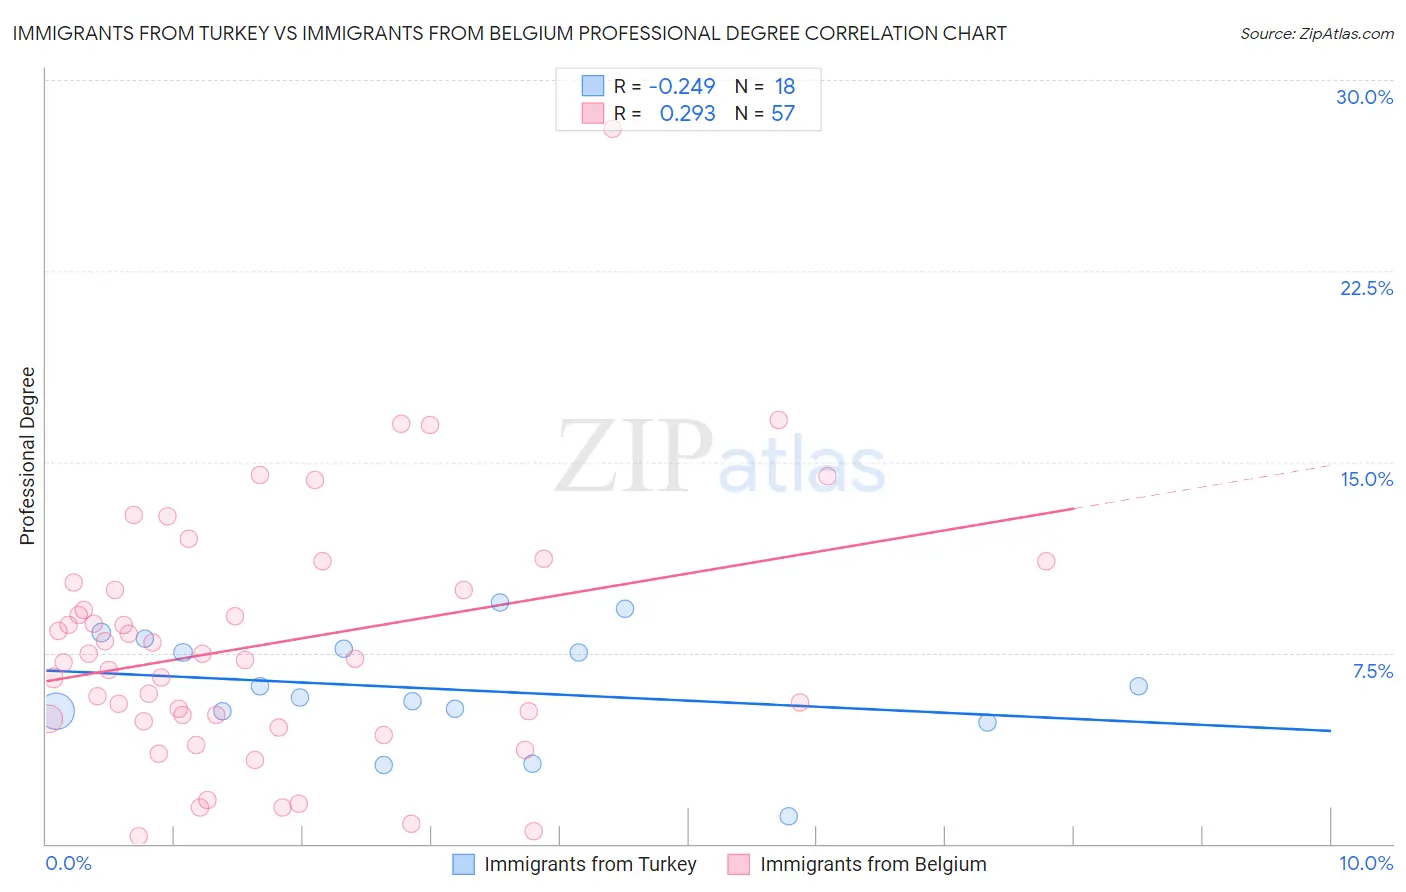
Immigrants from Turkey vs Immigrants from Belgium Professional Degree Correlation Chart
The statistical analysis conducted on geographies consisting of 222,933,233 people shows a weak negative correlation between the proportion of Immigrants from Turkey and percentage of population with at least professional degree education in the United States with a correlation coefficient (R) of -0.249 and weighted average of 6.2%. Similarly, the statistical analysis conducted on geographies consisting of 146,639,976 people shows a weak positive correlation between the proportion of Immigrants from Belgium and percentage of population with at least professional degree education in the United States with a correlation coefficient (R) of 0.293 and weighted average of 7.0%, a difference of 12.7%.
Professional Degree Correlation Summary
| Measurement | Immigrants from Turkey | Immigrants from Belgium |
| Minimum | 1.1% | 0.30% |
| Maximum | 9.5% | 28.1% |
| Range | 8.4% | 27.8% |
| Mean | 6.1% | 7.9% |
| Median | 6.0% | 7.3% |
| Interquartile 25% (IQ1) | 5.2% | 4.9% |
| Interquartile 75% (IQ3) | 7.7% | 10.1% |
| Interquartile Range (IQR) | 2.5% | 5.2% |
| Standard Deviation (Sample) | 2.2% | 5.0% |
| Standard Deviation (Population) | 2.2% | 4.9% |
Demographics Similar to Immigrants from Turkey and Immigrants from Belgium by Professional Degree
In terms of professional degree, the demographic groups most similar to Immigrants from Turkey are Immigrants from Sri Lanka (6.2%, a difference of 0.0%), Turkish (6.2%, a difference of 0.63%), Immigrants from Northern Europe (6.2%, a difference of 0.75%), Latvian (6.2%, a difference of 1.3%), and Immigrants from Ireland (6.3%, a difference of 2.1%). Similarly, the demographic groups most similar to Immigrants from Belgium are Cypriot (6.9%, a difference of 0.17%), Israeli (6.9%, a difference of 0.24%), Immigrants from Australia (6.9%, a difference of 0.66%), Immigrants from France (6.8%, a difference of 2.2%), and Immigrants from China (6.7%, a difference of 3.3%).
| Demographics | Rating | Rank | Professional Degree |
| Immigrants | Belgium | 100.0 /100 | #10 | Exceptional 7.0% |
| Cypriots | 100.0 /100 | #11 | Exceptional 6.9% |
| Israelis | 100.0 /100 | #12 | Exceptional 6.9% |
| Immigrants | Australia | 100.0 /100 | #13 | Exceptional 6.9% |
| Immigrants | France | 100.0 /100 | #14 | Exceptional 6.8% |
| Immigrants | China | 100.0 /100 | #15 | Exceptional 6.7% |
| Immigrants | Sweden | 100.0 /100 | #16 | Exceptional 6.7% |
| Immigrants | Eastern Asia | 100.0 /100 | #17 | Exceptional 6.6% |
| Soviet Union | 100.0 /100 | #18 | Exceptional 6.6% |
| Indians (Asian) | 100.0 /100 | #19 | Exceptional 6.5% |
| Immigrants | Denmark | 100.0 /100 | #20 | Exceptional 6.4% |
| Immigrants | Hong Kong | 100.0 /100 | #21 | Exceptional 6.4% |
| Immigrants | Japan | 100.0 /100 | #22 | Exceptional 6.4% |
| Russians | 100.0 /100 | #23 | Exceptional 6.3% |
| Immigrants | Spain | 100.0 /100 | #24 | Exceptional 6.3% |
| Immigrants | Ireland | 100.0 /100 | #25 | Exceptional 6.3% |
| Latvians | 100.0 /100 | #26 | Exceptional 6.2% |
| Immigrants | Northern Europe | 100.0 /100 | #27 | Exceptional 6.2% |
| Turks | 100.0 /100 | #28 | Exceptional 6.2% |
| Immigrants | Sri Lanka | 100.0 /100 | #29 | Exceptional 6.2% |
| Immigrants | Turkey | 100.0 /100 | #30 | Exceptional 6.2% |