Chilean vs Thai Doctorate Degree

COMPARE

Chilean
Race
Ancestry
AfghanAfricanAlaska NativeAlaskan AthabascanAlbanianAleutAlsatianAmericanApacheArabArapahoArgentineanArmenianAssyrian/Chaldean/SyriacAustralianAustrianBahamianBangladeshiBarbadianBasqueBelgianBelizeanBermudanBhutaneseBlackfeetBolivianBrazilianBritishBritish West IndianBulgarianBurmeseCajunCambodianCanadianCape VerdeanCarpatho RusynCelticCentral AmericanCentral American IndianCherokeeCheyenneChickasawChileanChineseChippewaChoctawColombianColvilleComancheCosta RicanCreeCreekCroatianCrowCubanCypriotCzechCzechoslovakianDanishDelawareDominicanDutchDutch West IndianEastern EuropeanEcuadorianEgyptianEnglishEstonianEthiopianEuropeanFijianFilipinoFinnishFrenchFrench American IndianFrench CanadianGermanGerman RussianGhanaianGreekGuamanian/ChamorroGuatemalanGuyaneseHaitianHmongHonduranHopiHoumaHungarianIcelanderIndian (Asian)IndonesianInupiatIranianIraqiIrishIroquoisIsraeliItalianJamaicanJapaneseJordanianKenyanKiowaKoreanLaotianLatvianLebaneseLiberianLithuanianLumbeeLuxembourgerMacedonianMalaysianMalteseMarshalleseMenomineeMexicanMexican American IndianMongolianMoroccanNative HawaiianNavajoNepaleseNew ZealanderNicaraguanNigerianNorthern EuropeanNorwegianOkinawanOsageOttawaPaiutePakistaniPalestinianPanamanianParaguayanPennsylvania GermanPeruvianPimaPolishPortuguesePotawatomiPuebloPuerto RicanPuget Sound SalishRomanianRussianSalvadoranSamoanScandinavianScotch-IrishScottishSeminoleSenegaleseSerbianShoshoneSierra LeoneanSiouxSlavicSlovakSloveneSomaliSouth AfricanSouth AmericanSouth American IndianSoviet UnionSpaniardSpanishSpanish AmericanSpanish American IndianSri LankanSubsaharan AfricanSudaneseSwedishSwissSyrianTaiwaneseTlingit-HaidaTohono O'OdhamTonganTrinidadian and TobagonianTsimshianTurkishU.S. Virgin IslanderUgandanUkrainianUruguayanUteVenezuelanVietnameseWelshWest IndianYakamaYaquiYugoslavianYumanYup'ikZimbabwean
Immigration
NonimmigrantsImmigrantsAfghanistanAfricaAlbaniaArgentinaArmeniaAsiaAustraliaAustriaBahamasBangladeshBarbadosBelarusBelgiumBelizeBoliviaBosnia and HerzegovinaBrazilBulgariaBurma/MyanmarCabo VerdeCambodiaCameroonCanadaCaribbeanCentral AmericaChileChinaColombiaCongoCosta RicaCroatiaCubaCzechoslovakiaDenmarkDominicaDominican RepublicEastern AfricaEastern AsiaEastern EuropeEcuadorEgyptEl SalvadorEnglandEritreaEthiopiaEuropeFijiFranceGermanyGhanaGreeceGrenadaGuatemalaGuyanaHaitiHondurasHong KongHungaryIndiaIndonesiaIranIraqIrelandIsraelItalyJamaicaJapanJordanKazakhstanKenyaKoreaKuwaitLaosLatin AmericaLatviaLebanonLiberiaLithuaniaMalaysiaMexicoMicronesiaMiddle AfricaMoldovaMoroccoNepalNetherlandsNicaraguaNigeriaNorth AmericaNorth MacedoniaNorthern AfricaNorthern EuropeNorwayOceaniaPakistanPanamaPeruPhilippinesPolandPortugalRomaniaRussiaSaudi ArabiaScotlandSenegalSerbiaSierra LeoneSingaporeSomaliaSouth AfricaSouth AmericaSouth Central AsiaSouth Eastern AsiaSouthern EuropeSpainSri LankaSt. Vincent and the GrenadinesSudanSwedenSwitzerlandSyriaTaiwanThailandTrinidad and TobagoTurkeyUgandaUkraineUruguayUzbekistanVenezuelaVietnamWest IndiesWestern AfricaWestern AsiaWestern EuropeYemenZaireZimbabweAzores
Thai
Race
Ancestry
AfghanAfricanAlaska NativeAlaskan AthabascanAlbanianAleutAlsatianAmericanApacheArabArapahoArgentineanArmenianAssyrian/Chaldean/SyriacAustralianAustrianBahamianBangladeshiBarbadianBasqueBelgianBelizeanBermudanBhutaneseBlackfeetBolivianBrazilianBritishBritish West IndianBulgarianBurmeseCajunCambodianCanadianCape VerdeanCarpatho RusynCelticCentral AmericanCentral American IndianCherokeeCheyenneChickasawChineseChippewaChoctawColombianColvilleComancheCosta RicanCreeCreekCroatianCrowCubanCypriotCzechCzechoslovakianDanishDelawareDominicanDutchDutch West IndianEastern EuropeanEcuadorianEgyptianEnglishEstonianEthiopianEuropeanFijianFilipinoFinnishFrenchFrench American IndianFrench CanadianGermanGerman RussianGhanaianGreekGuamanian/ChamorroGuatemalanGuyaneseHaitianHmongHonduranHopiHoumaHungarianIcelanderIndian (Asian)IndonesianInupiatIranianIraqiIrishIroquoisIsraeliItalianJamaicanJapaneseJordanianKenyanKiowaKoreanLaotianLatvianLebaneseLiberianLithuanianLumbeeLuxembourgerMacedonianMalaysianMalteseMarshalleseMenomineeMexicanMexican American IndianMongolianMoroccanNative HawaiianNavajoNepaleseNew ZealanderNicaraguanNigerianNorthern EuropeanNorwegianOkinawanOsageOttawaPaiutePakistaniPalestinianPanamanianParaguayanPennsylvania GermanPeruvianPimaPolishPortuguesePotawatomiPuebloPuerto RicanPuget Sound SalishRomanianRussianSalvadoranSamoanScandinavianScotch-IrishScottishSeminoleSenegaleseSerbianShoshoneSierra LeoneanSiouxSlavicSlovakSloveneSomaliSouth AfricanSouth AmericanSouth American IndianSoviet UnionSpaniardSpanishSpanish AmericanSpanish American IndianSri LankanSubsaharan AfricanSudaneseSwedishSwissSyrianTaiwaneseThaiTlingit-HaidaTohono O'OdhamTonganTrinidadian and TobagonianTsimshianTurkishU.S. Virgin IslanderUgandanUkrainianUruguayanUteVenezuelanVietnameseWelshWest IndianYakamaYaquiYugoslavianYumanYup'ikZimbabwean
Immigration
NonimmigrantsImmigrantsAfghanistanAfricaAlbaniaArgentinaArmeniaAsiaAustraliaAustriaBahamasBangladeshBarbadosBelarusBelgiumBelizeBoliviaBosnia and HerzegovinaBrazilBulgariaBurma/MyanmarCabo VerdeCambodiaCameroonCanadaCaribbeanCentral AmericaChileChinaColombiaCongoCosta RicaCroatiaCubaCzechoslovakiaDenmarkDominicaDominican RepublicEastern AfricaEastern AsiaEastern EuropeEcuadorEgyptEl SalvadorEnglandEritreaEthiopiaEuropeFijiFranceGermanyGhanaGreeceGrenadaGuatemalaGuyanaHaitiHondurasHong KongHungaryIndiaIndonesiaIranIraqIrelandIsraelItalyJamaicaJapanJordanKazakhstanKenyaKoreaKuwaitLaosLatin AmericaLatviaLebanonLiberiaLithuaniaMalaysiaMexicoMicronesiaMiddle AfricaMoldovaMoroccoNepalNetherlandsNicaraguaNigeriaNorth AmericaNorth MacedoniaNorthern AfricaNorthern EuropeNorwayOceaniaPakistanPanamaPeruPhilippinesPolandPortugalRomaniaRussiaSaudi ArabiaScotlandSenegalSerbiaSierra LeoneSingaporeSomaliaSouth AfricaSouth AmericaSouth Central AsiaSouth Eastern AsiaSouthern EuropeSpainSri LankaSt. Vincent and the GrenadinesSudanSwedenSwitzerlandSyriaTaiwanThailandTrinidad and TobagoTurkeyUgandaUkraineUruguayUzbekistanVenezuelaVietnamWest IndiesWestern AfricaWestern AsiaWestern EuropeYemenZaireZimbabweAzores
Doctorate Degree
Income
Poverty
Unemployment
Labor Participation
Family Structure
Vehicle Availability
Education Level
Disability

Doctorate Degree Comparison

Chileans

Thais

Exceptional
Exceptional
2.2%
DOCTORATE DEGREE
99.1/ 100
METRIC RATING
92nd/ 347
METRIC RANK
2.8%
DOCTORATE DEGREE
100.0/ 100
METRIC RATING
21st/ 347
METRIC RANK

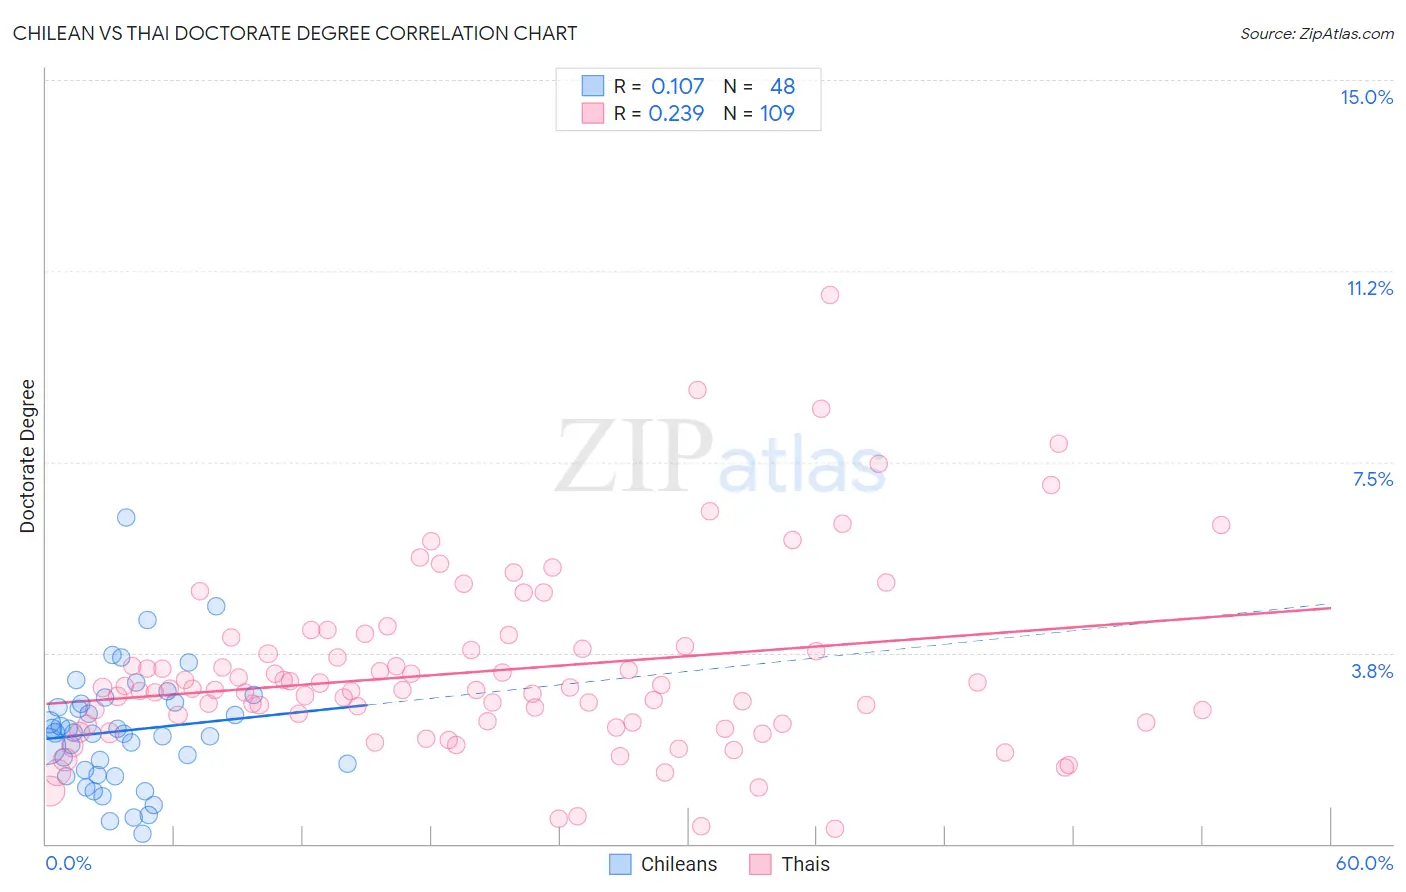
Chilean vs Thai Doctorate Degree Correlation Chart

The statistical analysis conducted on geographies consisting of 255,786,366 people shows a poor positive correlation between the proportion of Chileans and percentage of population with at least doctorate degree education in the United States with a correlation coefficient (R) of 0.107 and weighted average of 2.2%. Similarly, the statistical analysis conducted on geographies consisting of 470,013,150 people shows a weak positive correlation between the proportion of Thais and percentage of population with at least doctorate degree education in the United States with a correlation coefficient (R) of 0.239 and weighted average of 2.8%, a difference of 28.5%.
Chilean vs Thai Doctorate Degree

Doctorate Degree Correlation Summary

MeasurementChileanThai
Minimum0.19%0.30%
Maximum6.4%10.8%
Range6.2%10.5%
Mean2.2%3.4%
Median2.2%3.0%
Interquartile 25% (IQ1)1.4%2.4%
Interquartile 75% (IQ3)2.8%3.8%
Interquartile Range (IQR)1.4%1.5%
Standard Deviation (Sample)1.2%1.8%
Standard Deviation (Population)1.2%1.8%

Similar Demographics by Doctorate Degree

Demographics Similar to Chileans by Doctorate Degree

In terms of doctorate degree, the demographic groups most similar to Chileans are Alsatian (2.1%, a difference of 0.22%), Immigrants from Sudan (2.2%, a difference of 0.26%), Immigrants from Scotland (2.2%, a difference of 0.73%), British (2.2%, a difference of 0.75%), and Greek (2.1%, a difference of 0.85%).
DemographicsRating | RankDoctorate Degree
Immigrants | Brazil
99.6
/100
|
#85
Exceptional
2.2%
Egyptians
99.4
/100
|
#86
Exceptional
2.2%
Immigrants | Zimbabwe
99.4
/100
|
#87
Exceptional
2.2%
Immigrants | Nepal
99.3
/100
|
#88
Exceptional
2.2%
British
99.3
/100
|
#89
Exceptional
2.2%
Immigrants | Scotland
99.2
/100
|
#90
Exceptional
2.2%
Immigrants | Sudan
99.1
/100
|
#91
Exceptional
2.2%
Chileans
99.1
/100
|
#92
Exceptional
2.2%
Alsatians
99.0
/100
|
#93
Exceptional
2.1%
Greeks
98.8
/100
|
#94
Exceptional
2.1%
Immigrants | Romania
98.7
/100
|
#95
Exceptional
2.1%
Immigrants | Northern Africa
98.4
/100
|
#96
Exceptional
2.1%
Immigrants | Eritrea
98.4
/100
|
#97
Exceptional
2.1%
Armenians
98.3
/100
|
#98
Exceptional
2.1%
Immigrants | Egypt
98.2
/100
|
#99
Exceptional
2.1%

Demographics Similar to Thais by Doctorate Degree

In terms of doctorate degree, the demographic groups most similar to Thais are Mongolian (2.8%, a difference of 0.20%), Immigrants from Denmark (2.8%, a difference of 0.33%), Immigrants from Hong Kong (2.8%, a difference of 0.35%), Immigrants from Japan (2.8%, a difference of 0.70%), and Immigrants from Sri Lanka (2.8%, a difference of 1.1%).
DemographicsRating | RankDoctorate Degree
Immigrants | France
100.0
/100
|
#14
Exceptional
2.9%
Immigrants | India
100.0
/100
|
#15
Exceptional
2.8%
Eastern Europeans
100.0
/100
|
#16
Exceptional
2.8%
Immigrants | Australia
100.0
/100
|
#17
Exceptional
2.8%
Immigrants | Sri Lanka
100.0
/100
|
#18
Exceptional
2.8%
Immigrants | Japan
100.0
/100
|
#19
Exceptional
2.8%
Immigrants | Hong Kong
100.0
/100
|
#20
Exceptional
2.8%
Thais
100.0
/100
|
#21
Exceptional
2.8%
Mongolians
100.0
/100
|
#22
Exceptional
2.8%
Immigrants | Denmark
100.0
/100
|
#23
Exceptional
2.8%
Israelis
100.0
/100
|
#24
Exceptional
2.7%
Immigrants | Saudi Arabia
100.0
/100
|
#25
Exceptional
2.7%
Turks
100.0
/100
|
#26
Exceptional
2.7%
Immigrants | Turkey
100.0
/100
|
#27
Exceptional
2.6%
Burmese
100.0
/100
|
#28
Exceptional
2.6%