Chilean vs Immigrants from Italy Doctorate Degree
COMPARE
Chilean
Immigrants from Italy
Doctorate Degree
Doctorate Degree Comparison
Chileans
Immigrants from Italy
2.2%
DOCTORATE DEGREE
99.1/ 100
METRIC RATING
92nd/ 347
METRIC RANK
2.1%
DOCTORATE DEGREE
96.9/ 100
METRIC RATING
113th/ 347
METRIC RANK
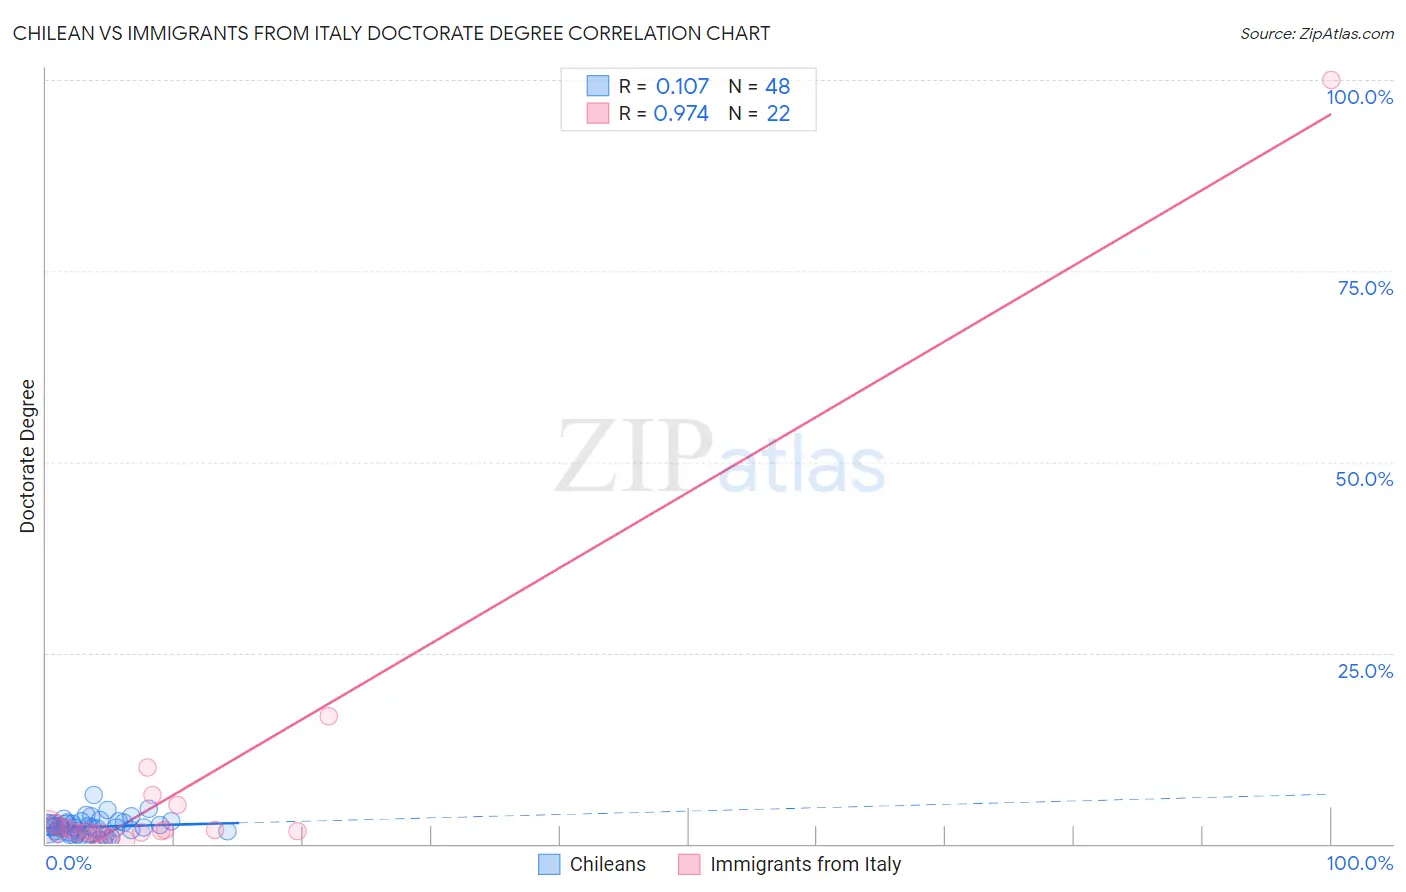
Chilean vs Immigrants from Italy Doctorate Degree Correlation Chart
The statistical analysis conducted on geographies consisting of 255,786,366 people shows a poor positive correlation between the proportion of Chileans and percentage of population with at least doctorate degree education in the United States with a correlation coefficient (R) of 0.107 and weighted average of 2.2%. Similarly, the statistical analysis conducted on geographies consisting of 322,534,686 people shows a perfect positive correlation between the proportion of Immigrants from Italy and percentage of population with at least doctorate degree education in the United States with a correlation coefficient (R) of 0.974 and weighted average of 2.1%, a difference of 3.9%.
Doctorate Degree Correlation Summary
| Measurement | Chilean | Immigrants from Italy |
| Minimum | 0.19% | 0.55% |
| Maximum | 6.4% | 100.0% |
| Range | 6.2% | 99.5% |
| Mean | 2.2% | 7.5% |
| Median | 2.2% | 1.7% |
| Interquartile 25% (IQ1) | 1.4% | 1.4% |
| Interquartile 75% (IQ3) | 2.8% | 2.6% |
| Interquartile Range (IQR) | 1.4% | 1.2% |
| Standard Deviation (Sample) | 1.2% | 21.0% |
| Standard Deviation (Population) | 1.2% | 20.5% |
Similar Demographics by Doctorate Degree
Demographics Similar to Chileans by Doctorate Degree
In terms of doctorate degree, the demographic groups most similar to Chileans are Alsatian (2.1%, a difference of 0.22%), Immigrants from Sudan (2.2%, a difference of 0.26%), Immigrants from Scotland (2.2%, a difference of 0.73%), British (2.2%, a difference of 0.75%), and Greek (2.1%, a difference of 0.85%).
| Demographics | Rating | Rank | Doctorate Degree |
| Immigrants | Brazil | 99.6 /100 | #85 | Exceptional 2.2% |
| Egyptians | 99.4 /100 | #86 | Exceptional 2.2% |
| Immigrants | Zimbabwe | 99.4 /100 | #87 | Exceptional 2.2% |
| Immigrants | Nepal | 99.3 /100 | #88 | Exceptional 2.2% |
| British | 99.3 /100 | #89 | Exceptional 2.2% |
| Immigrants | Scotland | 99.2 /100 | #90 | Exceptional 2.2% |
| Immigrants | Sudan | 99.1 /100 | #91 | Exceptional 2.2% |
| Chileans | 99.1 /100 | #92 | Exceptional 2.2% |
| Alsatians | 99.0 /100 | #93 | Exceptional 2.1% |
| Greeks | 98.8 /100 | #94 | Exceptional 2.1% |
| Immigrants | Romania | 98.7 /100 | #95 | Exceptional 2.1% |
| Immigrants | Northern Africa | 98.4 /100 | #96 | Exceptional 2.1% |
| Immigrants | Eritrea | 98.4 /100 | #97 | Exceptional 2.1% |
| Armenians | 98.3 /100 | #98 | Exceptional 2.1% |
| Immigrants | Egypt | 98.2 /100 | #99 | Exceptional 2.1% |
Demographics Similar to Immigrants from Italy by Doctorate Degree
In terms of doctorate degree, the demographic groups most similar to Immigrants from Italy are Immigrants from Croatia (2.1%, a difference of 0.15%), Syrian (2.1%, a difference of 0.21%), Immigrants from Pakistan (2.1%, a difference of 0.23%), Taiwanese (2.1%, a difference of 0.23%), and Brazilian (2.1%, a difference of 0.29%).
| Demographics | Rating | Rank | Doctorate Degree |
| Sudanese | 97.7 /100 | #106 | Exceptional 2.1% |
| Europeans | 97.5 /100 | #107 | Exceptional 2.1% |
| Immigrants | Germany | 97.3 /100 | #108 | Exceptional 2.1% |
| Ukrainians | 97.2 /100 | #109 | Exceptional 2.1% |
| Brazilians | 97.2 /100 | #110 | Exceptional 2.1% |
| Immigrants | Pakistan | 97.1 /100 | #111 | Exceptional 2.1% |
| Syrians | 97.1 /100 | #112 | Exceptional 2.1% |
| Immigrants | Italy | 96.9 /100 | #113 | Exceptional 2.1% |
| Immigrants | Croatia | 96.8 /100 | #114 | Exceptional 2.1% |
| Taiwanese | 96.7 /100 | #115 | Exceptional 2.1% |
| Maltese | 96.2 /100 | #116 | Exceptional 2.1% |
| Lebanese | 96.0 /100 | #117 | Exceptional 2.1% |
| Icelanders | 96.0 /100 | #118 | Exceptional 2.1% |
| Pakistanis | 95.8 /100 | #119 | Exceptional 2.0% |
| Immigrants | Morocco | 95.5 /100 | #120 | Exceptional 2.0% |