Chilean vs Immigrants from Dominican Republic Doctorate Degree
COMPARE
Chilean
Immigrants from Dominican Republic
Doctorate Degree
Doctorate Degree Comparison
Chileans
Immigrants from Dominican Republic
2.2%
DOCTORATE DEGREE
99.1/ 100
METRIC RATING
92nd/ 347
METRIC RANK
1.3%
DOCTORATE DEGREE
0.0/ 100
METRIC RATING
334th/ 347
METRIC RANK
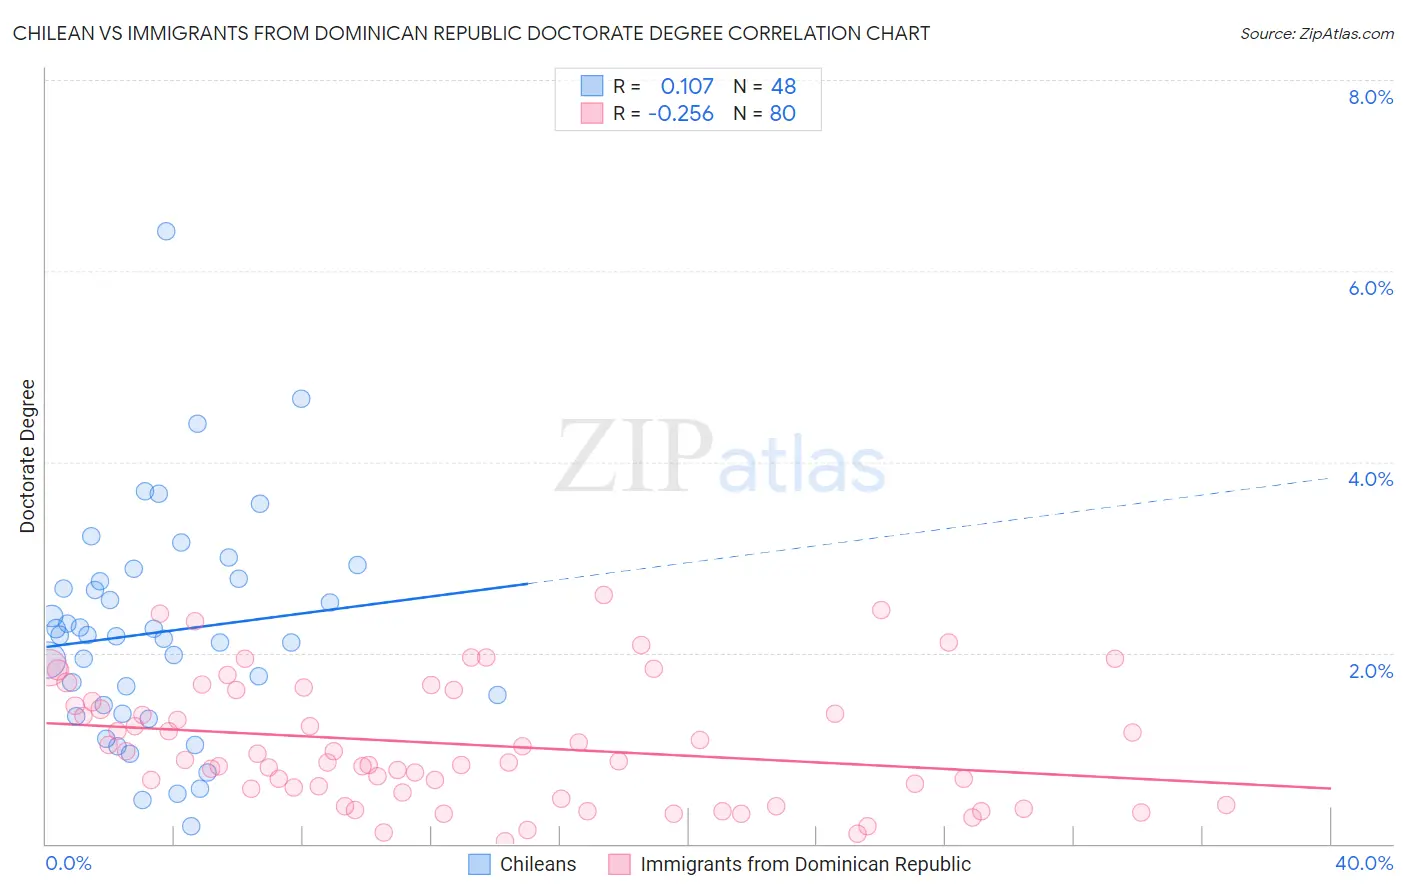
Chilean vs Immigrants from Dominican Republic Doctorate Degree Correlation Chart
The statistical analysis conducted on geographies consisting of 255,786,366 people shows a poor positive correlation between the proportion of Chileans and percentage of population with at least doctorate degree education in the United States with a correlation coefficient (R) of 0.107 and weighted average of 2.2%. Similarly, the statistical analysis conducted on geographies consisting of 273,260,616 people shows a weak negative correlation between the proportion of Immigrants from Dominican Republic and percentage of population with at least doctorate degree education in the United States with a correlation coefficient (R) of -0.256 and weighted average of 1.3%, a difference of 68.3%.
Doctorate Degree Correlation Summary
| Measurement | Chilean | Immigrants from Dominican Republic |
| Minimum | 0.19% | 0.033% |
| Maximum | 6.4% | 2.6% |
| Range | 6.2% | 2.6% |
| Mean | 2.2% | 1.0% |
| Median | 2.2% | 0.87% |
| Interquartile 25% (IQ1) | 1.4% | 0.56% |
| Interquartile 75% (IQ3) | 2.8% | 1.5% |
| Interquartile Range (IQR) | 1.4% | 0.99% |
| Standard Deviation (Sample) | 1.2% | 0.64% |
| Standard Deviation (Population) | 1.2% | 0.64% |
Similar Demographics by Doctorate Degree
Demographics Similar to Chileans by Doctorate Degree
In terms of doctorate degree, the demographic groups most similar to Chileans are Alsatian (2.1%, a difference of 0.22%), Immigrants from Sudan (2.2%, a difference of 0.26%), Immigrants from Scotland (2.2%, a difference of 0.73%), British (2.2%, a difference of 0.75%), and Greek (2.1%, a difference of 0.85%).
| Demographics | Rating | Rank | Doctorate Degree |
| Immigrants | Brazil | 99.6 /100 | #85 | Exceptional 2.2% |
| Egyptians | 99.4 /100 | #86 | Exceptional 2.2% |
| Immigrants | Zimbabwe | 99.4 /100 | #87 | Exceptional 2.2% |
| Immigrants | Nepal | 99.3 /100 | #88 | Exceptional 2.2% |
| British | 99.3 /100 | #89 | Exceptional 2.2% |
| Immigrants | Scotland | 99.2 /100 | #90 | Exceptional 2.2% |
| Immigrants | Sudan | 99.1 /100 | #91 | Exceptional 2.2% |
| Chileans | 99.1 /100 | #92 | Exceptional 2.2% |
| Alsatians | 99.0 /100 | #93 | Exceptional 2.1% |
| Greeks | 98.8 /100 | #94 | Exceptional 2.1% |
| Immigrants | Romania | 98.7 /100 | #95 | Exceptional 2.1% |
| Immigrants | Northern Africa | 98.4 /100 | #96 | Exceptional 2.1% |
| Immigrants | Eritrea | 98.4 /100 | #97 | Exceptional 2.1% |
| Armenians | 98.3 /100 | #98 | Exceptional 2.1% |
| Immigrants | Egypt | 98.2 /100 | #99 | Exceptional 2.1% |
Demographics Similar to Immigrants from Dominican Republic by Doctorate Degree
In terms of doctorate degree, the demographic groups most similar to Immigrants from Dominican Republic are Immigrants from Caribbean (1.3%, a difference of 0.19%), Yakama (1.3%, a difference of 0.35%), Immigrants from Haiti (1.3%, a difference of 1.8%), Immigrants from Latin America (1.3%, a difference of 1.9%), and Yup'ik (1.3%, a difference of 1.9%).
| Demographics | Rating | Rank | Doctorate Degree |
| Hispanics or Latinos | 0.0 /100 | #327 | Tragic 1.3% |
| Inupiat | 0.0 /100 | #328 | Tragic 1.3% |
| Haitians | 0.0 /100 | #329 | Tragic 1.3% |
| Yup'ik | 0.0 /100 | #330 | Tragic 1.3% |
| Immigrants | Latin America | 0.0 /100 | #331 | Tragic 1.3% |
| Yakama | 0.0 /100 | #332 | Tragic 1.3% |
| Immigrants | Caribbean | 0.0 /100 | #333 | Tragic 1.3% |
| Immigrants | Dominican Republic | 0.0 /100 | #334 | Tragic 1.3% |
| Immigrants | Haiti | 0.0 /100 | #335 | Tragic 1.3% |
| Nepalese | 0.0 /100 | #336 | Tragic 1.3% |
| Bangladeshis | 0.0 /100 | #337 | Tragic 1.2% |
| Puget Sound Salish | 0.0 /100 | #338 | Tragic 1.2% |
| Immigrants | Central America | 0.0 /100 | #339 | Tragic 1.2% |
| Immigrants | Cuba | 0.0 /100 | #340 | Tragic 1.2% |
| Mexicans | 0.0 /100 | #341 | Tragic 1.2% |