Cape Verdean vs Immigrants from Vietnam No Schooling Completed
COMPARE
Cape Verdean
Immigrants from Vietnam
No Schooling Completed
No Schooling Completed Comparison
Cape Verdeans
Immigrants from Vietnam
3.1%
NO SCHOOLING COMPLETED
0.0/ 100
METRIC RATING
317th/ 347
METRIC RANK
3.3%
NO SCHOOLING COMPLETED
0.0/ 100
METRIC RATING
329th/ 347
METRIC RANK
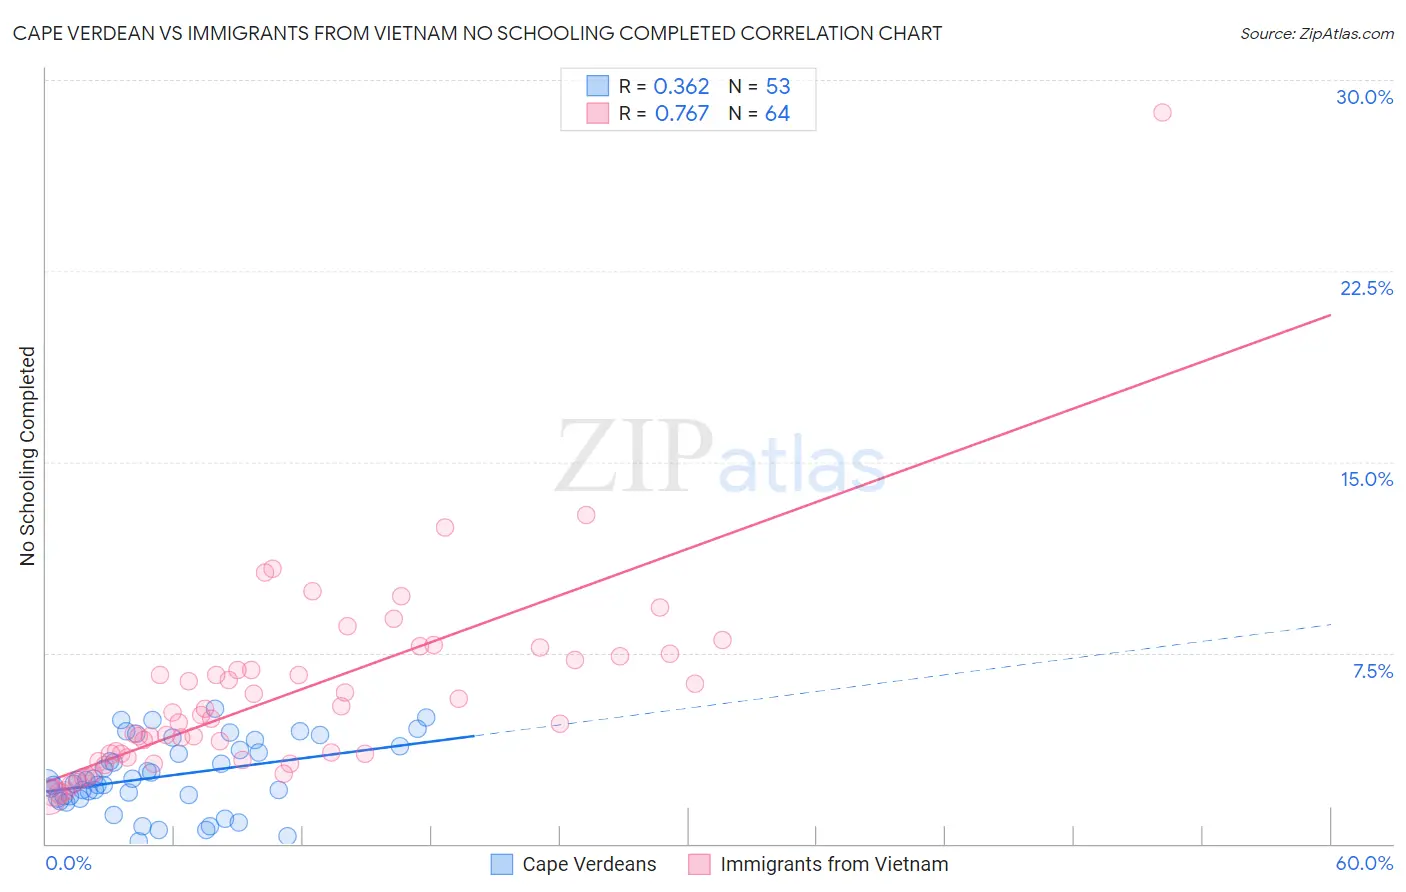
Cape Verdean vs Immigrants from Vietnam No Schooling Completed Correlation Chart
The statistical analysis conducted on geographies consisting of 107,247,027 people shows a mild positive correlation between the proportion of Cape Verdeans and percentage of population with no schooling in the United States with a correlation coefficient (R) of 0.362 and weighted average of 3.1%. Similarly, the statistical analysis conducted on geographies consisting of 401,890,779 people shows a strong positive correlation between the proportion of Immigrants from Vietnam and percentage of population with no schooling in the United States with a correlation coefficient (R) of 0.767 and weighted average of 3.3%, a difference of 7.5%.
No Schooling Completed Correlation Summary
| Measurement | Cape Verdean | Immigrants from Vietnam |
| Minimum | 0.088% | 1.9% |
| Maximum | 5.3% | 28.7% |
| Range | 5.2% | 26.8% |
| Mean | 2.6% | 5.9% |
| Median | 2.4% | 5.0% |
| Interquartile 25% (IQ1) | 1.8% | 3.5% |
| Interquartile 75% (IQ3) | 3.7% | 7.3% |
| Interquartile Range (IQR) | 1.9% | 3.8% |
| Standard Deviation (Sample) | 1.3% | 3.9% |
| Standard Deviation (Population) | 1.3% | 3.9% |
Demographics Similar to Cape Verdeans and Immigrants from Vietnam by No Schooling Completed
In terms of no schooling completed, the demographic groups most similar to Cape Verdeans are Immigrants from Ecuador (3.1%, a difference of 0.49%), Immigrants from Guyana (3.1%, a difference of 0.68%), Immigrants from Nicaragua (3.1%, a difference of 0.84%), Immigrants from Belize (3.1%, a difference of 1.1%), and Honduran (3.1%, a difference of 1.2%). Similarly, the demographic groups most similar to Immigrants from Vietnam are Immigrants from Armenia (3.3%, a difference of 0.42%), Japanese (3.3%, a difference of 0.45%), Mexican (3.3%, a difference of 1.1%), Immigrants from Latin America (3.3%, a difference of 1.3%), and Central American (3.4%, a difference of 2.0%).
| Demographics | Rating | Rank | No Schooling Completed |
| Hondurans | 0.0 /100 | #313 | Tragic 3.1% |
| Immigrants | Belize | 0.0 /100 | #314 | Tragic 3.1% |
| Immigrants | Nicaragua | 0.0 /100 | #315 | Tragic 3.1% |
| Immigrants | Ecuador | 0.0 /100 | #316 | Tragic 3.1% |
| Cape Verdeans | 0.0 /100 | #317 | Tragic 3.1% |
| Immigrants | Guyana | 0.0 /100 | #318 | Tragic 3.1% |
| Immigrants | Burma/Myanmar | 0.0 /100 | #319 | Tragic 3.1% |
| Immigrants | Bangladesh | 0.0 /100 | #320 | Tragic 3.1% |
| Immigrants | Laos | 0.0 /100 | #321 | Tragic 3.1% |
| Immigrants | Honduras | 0.0 /100 | #322 | Tragic 3.2% |
| Vietnamese | 0.0 /100 | #323 | Tragic 3.2% |
| Mexican American Indians | 0.0 /100 | #324 | Tragic 3.2% |
| Dominicans | 0.0 /100 | #325 | Tragic 3.2% |
| Indonesians | 0.0 /100 | #326 | Tragic 3.2% |
| Immigrants | Latin America | 0.0 /100 | #327 | Tragic 3.3% |
| Mexicans | 0.0 /100 | #328 | Tragic 3.3% |
| Immigrants | Vietnam | 0.0 /100 | #329 | Tragic 3.3% |
| Immigrants | Armenia | 0.0 /100 | #330 | Tragic 3.3% |
| Japanese | 0.0 /100 | #331 | Tragic 3.3% |
| Central Americans | 0.0 /100 | #332 | Tragic 3.4% |
| Immigrants | Dominican Republic | 0.0 /100 | #333 | Tragic 3.4% |