Burmese vs Immigrants from Latvia Professional Degree
COMPARE
Burmese
Immigrants from Latvia
Professional Degree
Professional Degree Comparison
Burmese
Immigrants from Latvia
6.1%
PROFESSIONAL DEGREE
100.0/ 100
METRIC RATING
33rd/ 347
METRIC RANK
5.8%
PROFESSIONAL DEGREE
100.0/ 100
METRIC RATING
49th/ 347
METRIC RANK
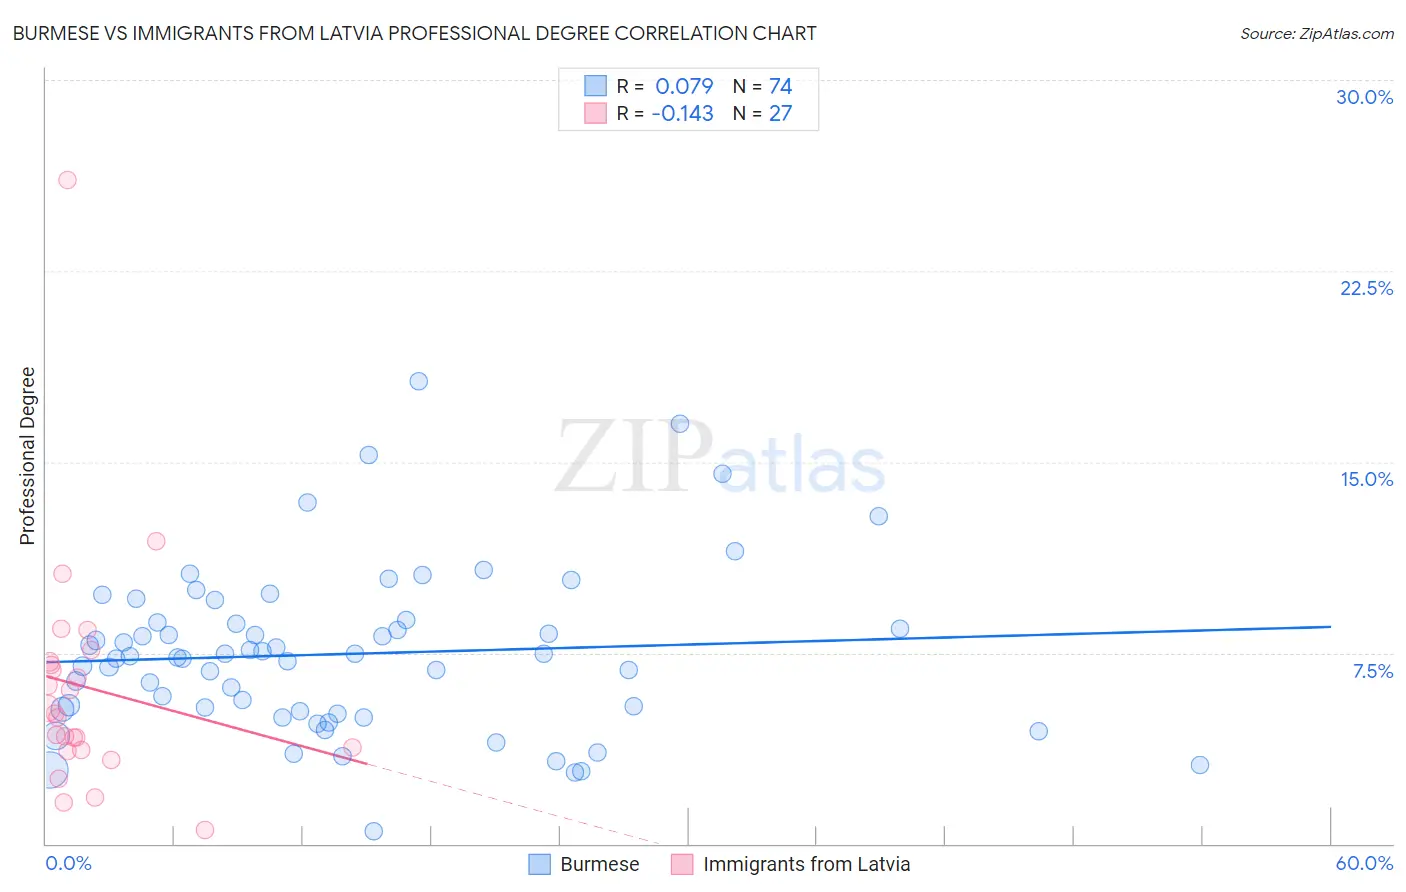
Burmese vs Immigrants from Latvia Professional Degree Correlation Chart
The statistical analysis conducted on geographies consisting of 463,932,708 people shows a slight positive correlation between the proportion of Burmese and percentage of population with at least professional degree education in the United States with a correlation coefficient (R) of 0.079 and weighted average of 6.1%. Similarly, the statistical analysis conducted on geographies consisting of 113,713,162 people shows a poor negative correlation between the proportion of Immigrants from Latvia and percentage of population with at least professional degree education in the United States with a correlation coefficient (R) of -0.143 and weighted average of 5.8%, a difference of 5.2%.
Professional Degree Correlation Summary
| Measurement | Burmese | Immigrants from Latvia |
| Minimum | 0.47% | 0.54% |
| Maximum | 18.2% | 26.1% |
| Range | 17.7% | 25.5% |
| Mean | 7.5% | 6.1% |
| Median | 7.3% | 5.1% |
| Interquartile 25% (IQ1) | 5.2% | 3.7% |
| Interquartile 75% (IQ3) | 8.7% | 7.1% |
| Interquartile Range (IQR) | 3.5% | 3.4% |
| Standard Deviation (Sample) | 3.3% | 4.8% |
| Standard Deviation (Population) | 3.2% | 4.7% |
Demographics Similar to Burmese and Immigrants from Latvia by Professional Degree
In terms of professional degree, the demographic groups most similar to Burmese are Thai (6.1%, a difference of 0.030%), Mongolian (6.1%, a difference of 0.13%), Immigrants from India (6.2%, a difference of 0.27%), Immigrants from Korea (6.1%, a difference of 0.80%), and Immigrants from Russia (6.0%, a difference of 1.7%). Similarly, the demographic groups most similar to Immigrants from Latvia are Immigrants from Czechoslovakia (5.8%, a difference of 0.32%), Immigrants from Greece (5.8%, a difference of 0.38%), Paraguayan (5.9%, a difference of 0.40%), Australian (5.9%, a difference of 0.82%), and Immigrants from Argentina (5.9%, a difference of 0.83%).
| Demographics | Rating | Rank | Professional Degree |
| Immigrants | India | 100.0 /100 | #31 | Exceptional 6.2% |
| Thais | 100.0 /100 | #32 | Exceptional 6.1% |
| Burmese | 100.0 /100 | #33 | Exceptional 6.1% |
| Mongolians | 100.0 /100 | #34 | Exceptional 6.1% |
| Immigrants | Korea | 100.0 /100 | #35 | Exceptional 6.1% |
| Immigrants | Russia | 100.0 /100 | #36 | Exceptional 6.0% |
| Immigrants | Austria | 100.0 /100 | #37 | Exceptional 6.0% |
| Immigrants | Norway | 100.0 /100 | #38 | Exceptional 6.0% |
| Immigrants | South Africa | 100.0 /100 | #39 | Exceptional 6.0% |
| Cambodians | 100.0 /100 | #40 | Exceptional 6.0% |
| New Zealanders | 100.0 /100 | #41 | Exceptional 6.0% |
| Estonians | 100.0 /100 | #42 | Exceptional 6.0% |
| Immigrants | Saudi Arabia | 100.0 /100 | #43 | Exceptional 5.9% |
| Argentineans | 100.0 /100 | #44 | Exceptional 5.9% |
| Immigrants | South Central Asia | 100.0 /100 | #45 | Exceptional 5.9% |
| Immigrants | Argentina | 100.0 /100 | #46 | Exceptional 5.9% |
| Australians | 100.0 /100 | #47 | Exceptional 5.9% |
| Paraguayans | 100.0 /100 | #48 | Exceptional 5.9% |
| Immigrants | Latvia | 100.0 /100 | #49 | Exceptional 5.8% |
| Immigrants | Czechoslovakia | 100.0 /100 | #50 | Exceptional 5.8% |
| Immigrants | Greece | 100.0 /100 | #51 | Exceptional 5.8% |