Burmese vs Immigrants from Cabo Verde Professional Degree

COMPARE

Burmese
Race
Ancestry
AfghanAfricanAlaska NativeAlaskan AthabascanAlbanianAleutAlsatianAmericanApacheArabArapahoArgentineanArmenianAssyrian/Chaldean/SyriacAustralianAustrianBahamianBangladeshiBarbadianBasqueBelgianBelizeanBermudanBhutaneseBlackfeetBolivianBrazilianBritishBritish West IndianBulgarianBurmeseCajunCambodianCanadianCape VerdeanCarpatho RusynCelticCentral AmericanCentral American IndianCherokeeCheyenneChickasawChileanChineseChippewaChoctawColombianColvilleComancheCosta RicanCreeCreekCroatianCrowCubanCypriotCzechCzechoslovakianDanishDelawareDominicanDutchDutch West IndianEastern EuropeanEcuadorianEgyptianEnglishEstonianEthiopianEuropeanFijianFilipinoFinnishFrenchFrench American IndianFrench CanadianGermanGerman RussianGhanaianGreekGuamanian/ChamorroGuatemalanGuyaneseHaitianHmongHonduranHopiHoumaHungarianIcelanderIndian (Asian)IndonesianInupiatIranianIraqiIrishIroquoisIsraeliItalianJamaicanJapaneseJordanianKenyanKiowaKoreanLaotianLatvianLebaneseLiberianLithuanianLumbeeLuxembourgerMacedonianMalaysianMalteseMarshalleseMenomineeMexicanMexican American IndianMongolianMoroccanNative HawaiianNavajoNepaleseNew ZealanderNicaraguanNigerianNorthern EuropeanNorwegianOkinawanOsageOttawaPaiutePakistaniPalestinianPanamanianParaguayanPennsylvania GermanPeruvianPimaPolishPortuguesePotawatomiPuebloPuerto RicanPuget Sound SalishRomanianRussianSalvadoranSamoanScandinavianScotch-IrishScottishSeminoleSenegaleseSerbianShoshoneSierra LeoneanSiouxSlavicSlovakSloveneSomaliSouth AfricanSouth AmericanSouth American IndianSoviet UnionSpaniardSpanishSpanish AmericanSpanish American IndianSri LankanSubsaharan AfricanSudaneseSwedishSwissSyrianTaiwaneseThaiTlingit-HaidaTohono O'OdhamTonganTrinidadian and TobagonianTsimshianTurkishU.S. Virgin IslanderUgandanUkrainianUruguayanUteVenezuelanVietnameseWelshWest IndianYakamaYaquiYugoslavianYumanYup'ikZimbabwean
Immigration
NonimmigrantsImmigrantsAfghanistanAfricaAlbaniaArgentinaArmeniaAsiaAustraliaAustriaBahamasBangladeshBarbadosBelarusBelgiumBelizeBoliviaBosnia and HerzegovinaBrazilBulgariaBurma/MyanmarCambodiaCameroonCanadaCaribbeanCentral AmericaChileChinaColombiaCongoCosta RicaCroatiaCubaCzechoslovakiaDenmarkDominicaDominican RepublicEastern AfricaEastern AsiaEastern EuropeEcuadorEgyptEl SalvadorEnglandEritreaEthiopiaEuropeFijiFranceGermanyGhanaGreeceGrenadaGuatemalaGuyanaHaitiHondurasHong KongHungaryIndiaIndonesiaIranIraqIrelandIsraelItalyJamaicaJapanJordanKazakhstanKenyaKoreaKuwaitLaosLatin AmericaLatviaLebanonLiberiaLithuaniaMalaysiaMexicoMicronesiaMiddle AfricaMoldovaMoroccoNepalNetherlandsNicaraguaNigeriaNorth AmericaNorth MacedoniaNorthern AfricaNorthern EuropeNorwayOceaniaPakistanPanamaPeruPhilippinesPolandPortugalRomaniaRussiaSaudi ArabiaScotlandSenegalSerbiaSierra LeoneSingaporeSomaliaSouth AfricaSouth AmericaSouth Central AsiaSouth Eastern AsiaSouthern EuropeSpainSri LankaSt. Vincent and the GrenadinesSudanSwedenSwitzerlandSyriaTaiwanThailandTrinidad and TobagoTurkeyUgandaUkraineUruguayUzbekistanVenezuelaVietnamWest IndiesWestern AfricaWestern AsiaWestern EuropeYemenZaireZimbabweAzores
Immigrants from Cabo Verde
Race
Ancestry
AfghanAfricanAlaska NativeAlaskan AthabascanAlbanianAleutAlsatianAmericanApacheArabArapahoArgentineanArmenianAssyrian/Chaldean/SyriacAustralianAustrianBahamianBangladeshiBarbadianBasqueBelgianBelizeanBermudanBhutaneseBlackfeetBolivianBrazilianBritishBritish West IndianBulgarianCajunCambodianCanadianCape VerdeanCarpatho RusynCelticCentral AmericanCentral American IndianCherokeeCheyenneChickasawChileanChineseChippewaChoctawColombianColvilleComancheCosta RicanCreeCreekCroatianCrowCubanCypriotCzechCzechoslovakianDanishDelawareDominicanDutchDutch West IndianEastern EuropeanEcuadorianEgyptianEnglishEstonianEthiopianEuropeanFijianFilipinoFinnishFrenchFrench American IndianFrench CanadianGermanGerman RussianGhanaianGreekGuamanian/ChamorroGuatemalanGuyaneseHaitianHmongHonduranHopiHoumaHungarianIcelanderIndian (Asian)IndonesianInupiatIranianIraqiIrishIroquoisIsraeliItalianJamaicanJapaneseJordanianKenyanKiowaKoreanLaotianLatvianLebaneseLiberianLithuanianLumbeeLuxembourgerMacedonianMalaysianMalteseMarshalleseMenomineeMexicanMexican American IndianMongolianMoroccanNative HawaiianNavajoNepaleseNew ZealanderNicaraguanNigerianNorthern EuropeanNorwegianOkinawanOsageOttawaPaiutePakistaniPalestinianPanamanianParaguayanPennsylvania GermanPeruvianPimaPolishPortuguesePotawatomiPuebloPuerto RicanPuget Sound SalishRomanianRussianSalvadoranSamoanScandinavianScotch-IrishScottishSeminoleSenegaleseSerbianShoshoneSierra LeoneanSiouxSlavicSlovakSloveneSomaliSouth AfricanSouth AmericanSouth American IndianSoviet UnionSpaniardSpanishSpanish AmericanSpanish American IndianSri LankanSubsaharan AfricanSudaneseSwedishSwissSyrianTaiwaneseThaiTlingit-HaidaTohono O'OdhamTonganTrinidadian and TobagonianTsimshianTurkishU.S. Virgin IslanderUgandanUkrainianUruguayanUteVenezuelanVietnameseWelshWest IndianYakamaYaquiYugoslavianYumanYup'ikZimbabwean
Immigration
NonimmigrantsImmigrantsAfghanistanAfricaAlbaniaArgentinaArmeniaAsiaAustraliaAustriaBahamasBangladeshBarbadosBelarusBelgiumBelizeBoliviaBosnia and HerzegovinaBrazilBulgariaBurma/MyanmarCabo VerdeCambodiaCameroonCanadaCaribbeanCentral AmericaChileChinaColombiaCongoCosta RicaCroatiaCubaCzechoslovakiaDenmarkDominicaDominican RepublicEastern AfricaEastern AsiaEastern EuropeEcuadorEgyptEl SalvadorEnglandEritreaEthiopiaEuropeFijiFranceGermanyGhanaGreeceGrenadaGuatemalaGuyanaHaitiHondurasHong KongHungaryIndiaIndonesiaIranIraqIrelandIsraelItalyJamaicaJapanJordanKazakhstanKenyaKoreaKuwaitLaosLatin AmericaLatviaLebanonLiberiaLithuaniaMalaysiaMexicoMicronesiaMiddle AfricaMoldovaMoroccoNepalNetherlandsNicaraguaNigeriaNorth AmericaNorth MacedoniaNorthern AfricaNorthern EuropeNorwayOceaniaPakistanPanamaPeruPhilippinesPolandPortugalRomaniaRussiaSaudi ArabiaScotlandSenegalSerbiaSierra LeoneSingaporeSomaliaSouth AfricaSouth AmericaSouth Central AsiaSouth Eastern AsiaSouthern EuropeSpainSri LankaSt. Vincent and the GrenadinesSudanSwedenSwitzerlandSyriaTaiwanThailandTrinidad and TobagoTurkeyUgandaUkraineUruguayUzbekistanVenezuelaVietnamWest IndiesWestern AfricaWestern AsiaWestern EuropeYemenZaireZimbabweAzores
Professional Degree
Income
Poverty
Unemployment
Labor Participation
Family Structure
Vehicle Availability
Education Level
Disability

Professional Degree Comparison

Burmese

Immigrants from Cabo Verde

Exceptional
Tragic
6.1%
PROFESSIONAL DEGREE
100.0/ 100
METRIC RATING
33rd/ 347
METRIC RANK
3.1%
PROFESSIONAL DEGREE
0.0/ 100
METRIC RATING
330th/ 347
METRIC RANK

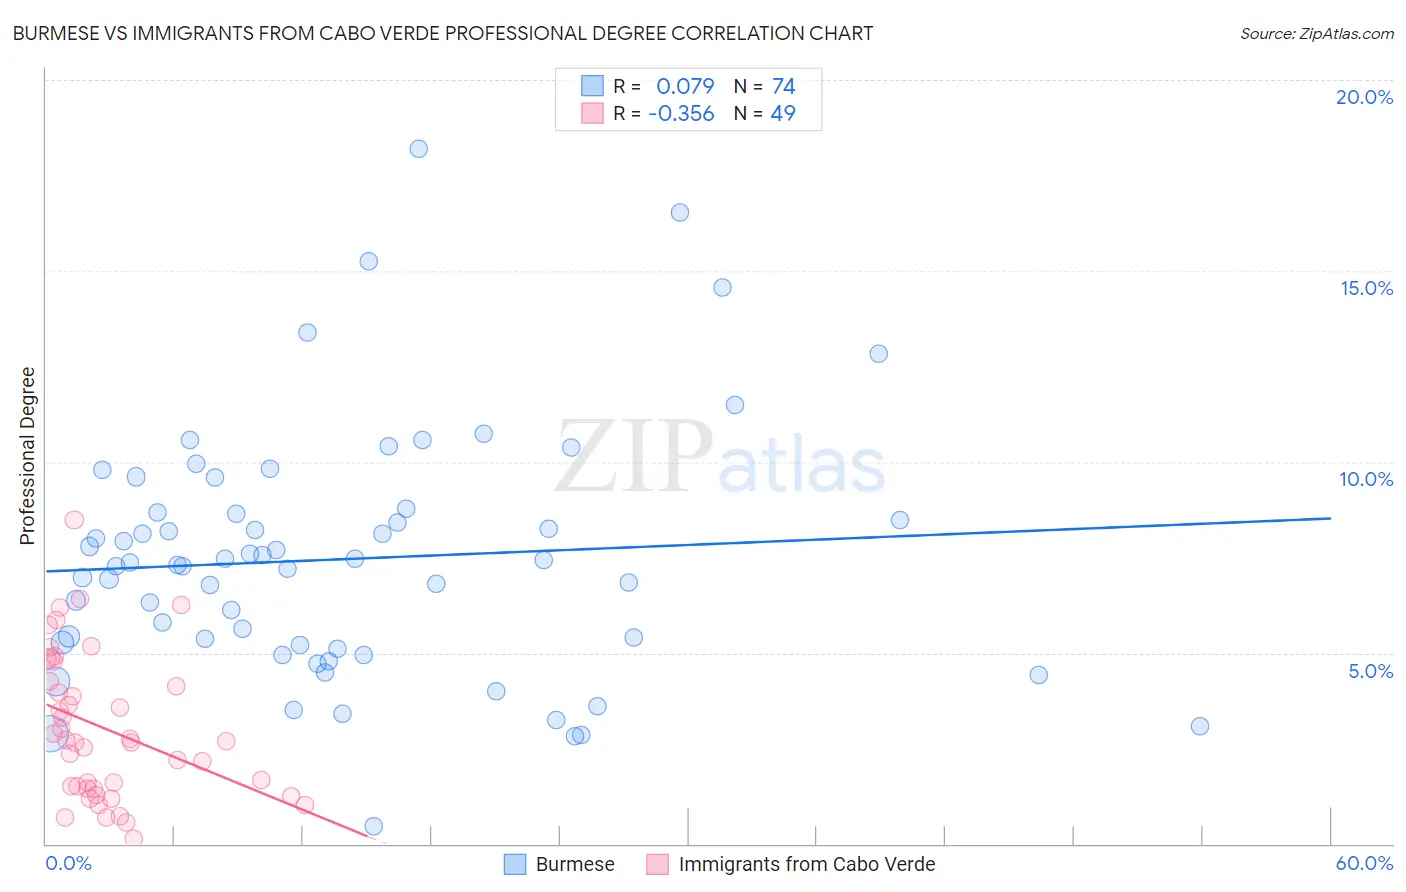
Burmese vs Immigrants from Cabo Verde Professional Degree Correlation Chart

The statistical analysis conducted on geographies consisting of 463,932,708 people shows a slight positive correlation between the proportion of Burmese and percentage of population with at least professional degree education in the United States with a correlation coefficient (R) of 0.079 and weighted average of 6.1%. Similarly, the statistical analysis conducted on geographies consisting of 38,118,065 people shows a mild negative correlation between the proportion of Immigrants from Cabo Verde and percentage of population with at least professional degree education in the United States with a correlation coefficient (R) of -0.356 and weighted average of 3.1%, a difference of 99.0%.
Burmese vs Immigrants from Cabo Verde Professional Degree

Professional Degree Correlation Summary

MeasurementBurmeseImmigrants from Cabo Verde
Minimum0.47%0.14%
Maximum18.2%8.5%
Range17.7%8.3%
Mean7.5%3.0%
Median7.3%2.7%
Interquartile 25% (IQ1)5.2%1.4%
Interquartile 75% (IQ3)8.7%4.5%
Interquartile Range (IQR)3.5%3.1%
Standard Deviation (Sample)3.3%1.9%
Standard Deviation (Population)3.2%1.9%

Similar Demographics by Professional Degree

Demographics Similar to Burmese by Professional Degree

In terms of professional degree, the demographic groups most similar to Burmese are Thai (6.1%, a difference of 0.030%), Mongolian (6.1%, a difference of 0.13%), Immigrants from India (6.2%, a difference of 0.27%), Immigrants from Sri Lanka (6.2%, a difference of 0.39%), and Immigrants from Turkey (6.2%, a difference of 0.39%).
DemographicsRating | RankProfessional Degree
Latvians
100.0
/100
|
#26
Exceptional
6.2%
Immigrants | Northern Europe
100.0
/100
|
#27
Exceptional
6.2%
Turks
100.0
/100
|
#28
Exceptional
6.2%
Immigrants | Sri Lanka
100.0
/100
|
#29
Exceptional
6.2%
Immigrants | Turkey
100.0
/100
|
#30
Exceptional
6.2%
Immigrants | India
100.0
/100
|
#31
Exceptional
6.2%
Thais
100.0
/100
|
#32
Exceptional
6.1%
Burmese
100.0
/100
|
#33
Exceptional
6.1%
Mongolians
100.0
/100
|
#34
Exceptional
6.1%
Immigrants | Korea
100.0
/100
|
#35
Exceptional
6.1%
Immigrants | Russia
100.0
/100
|
#36
Exceptional
6.0%
Immigrants | Austria
100.0
/100
|
#37
Exceptional
6.0%
Immigrants | Norway
100.0
/100
|
#38
Exceptional
6.0%
Immigrants | South Africa
100.0
/100
|
#39
Exceptional
6.0%
Cambodians
100.0
/100
|
#40
Exceptional
6.0%

Demographics Similar to Immigrants from Cabo Verde by Professional Degree

In terms of professional degree, the demographic groups most similar to Immigrants from Cabo Verde are Bangladeshi (3.1%, a difference of 0.080%), Kiowa (3.1%, a difference of 0.12%), Yakama (3.1%, a difference of 0.23%), Puget Sound Salish (3.1%, a difference of 0.26%), and Creek (3.1%, a difference of 0.29%).
DemographicsRating | RankProfessional Degree
Inupiat
0.0
/100
|
#323
Tragic
3.2%
Crow
0.0
/100
|
#324
Tragic
3.2%
Yaqui
0.0
/100
|
#325
Tragic
3.2%
Menominee
0.0
/100
|
#326
Tragic
3.1%
Dutch West Indians
0.0
/100
|
#327
Tragic
3.1%
Creek
0.0
/100
|
#328
Tragic
3.1%
Bangladeshis
0.0
/100
|
#329
Tragic
3.1%
Immigrants | Cabo Verde
0.0
/100
|
#330
Tragic
3.1%
Kiowa
0.0
/100
|
#331
Tragic
3.1%
Yakama
0.0
/100
|
#332
Tragic
3.1%
Puget Sound Salish
0.0
/100
|
#333
Tragic
3.1%
Pennsylvania Germans
0.0
/100
|
#334
Tragic
3.0%
Natives/Alaskans
0.0
/100
|
#335
Tragic
3.0%
Fijians
0.0
/100
|
#336
Tragic
2.9%
Arapaho
0.0
/100
|
#337
Tragic
2.9%