Burmese vs Immigrants from Eastern Europe Professional Degree
COMPARE
Burmese
Immigrants from Eastern Europe
Professional Degree
Professional Degree Comparison
Burmese
Immigrants from Eastern Europe
6.1%
PROFESSIONAL DEGREE
100.0/ 100
METRIC RATING
33rd/ 347
METRIC RANK
5.2%
PROFESSIONAL DEGREE
99.5/ 100
METRIC RATING
92nd/ 347
METRIC RANK
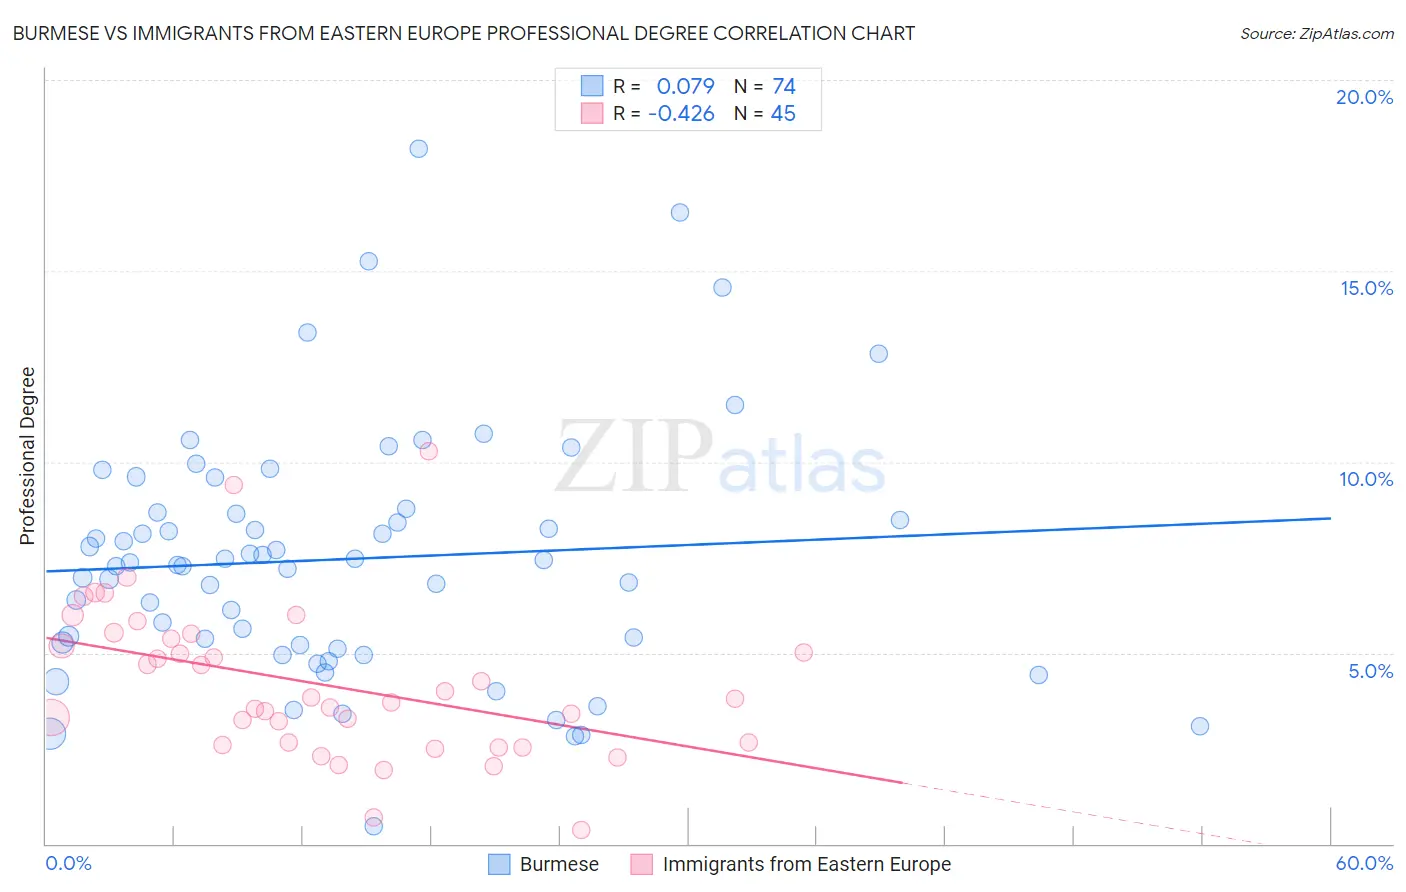
Burmese vs Immigrants from Eastern Europe Professional Degree Correlation Chart
The statistical analysis conducted on geographies consisting of 463,932,708 people shows a slight positive correlation between the proportion of Burmese and percentage of population with at least professional degree education in the United States with a correlation coefficient (R) of 0.079 and weighted average of 6.1%. Similarly, the statistical analysis conducted on geographies consisting of 474,383,803 people shows a moderate negative correlation between the proportion of Immigrants from Eastern Europe and percentage of population with at least professional degree education in the United States with a correlation coefficient (R) of -0.426 and weighted average of 5.2%, a difference of 17.2%.
Professional Degree Correlation Summary
| Measurement | Burmese | Immigrants from Eastern Europe |
| Minimum | 0.47% | 0.35% |
| Maximum | 18.2% | 10.3% |
| Range | 17.7% | 9.9% |
| Mean | 7.5% | 4.2% |
| Median | 7.3% | 3.8% |
| Interquartile 25% (IQ1) | 5.2% | 2.6% |
| Interquartile 75% (IQ3) | 8.7% | 5.4% |
| Interquartile Range (IQR) | 3.5% | 2.8% |
| Standard Deviation (Sample) | 3.3% | 2.0% |
| Standard Deviation (Population) | 3.2% | 2.0% |
Similar Demographics by Professional Degree
Demographics Similar to Burmese by Professional Degree
In terms of professional degree, the demographic groups most similar to Burmese are Thai (6.1%, a difference of 0.030%), Mongolian (6.1%, a difference of 0.13%), Immigrants from India (6.2%, a difference of 0.27%), Immigrants from Sri Lanka (6.2%, a difference of 0.39%), and Immigrants from Turkey (6.2%, a difference of 0.39%).
| Demographics | Rating | Rank | Professional Degree |
| Latvians | 100.0 /100 | #26 | Exceptional 6.2% |
| Immigrants | Northern Europe | 100.0 /100 | #27 | Exceptional 6.2% |
| Turks | 100.0 /100 | #28 | Exceptional 6.2% |
| Immigrants | Sri Lanka | 100.0 /100 | #29 | Exceptional 6.2% |
| Immigrants | Turkey | 100.0 /100 | #30 | Exceptional 6.2% |
| Immigrants | India | 100.0 /100 | #31 | Exceptional 6.2% |
| Thais | 100.0 /100 | #32 | Exceptional 6.1% |
| Burmese | 100.0 /100 | #33 | Exceptional 6.1% |
| Mongolians | 100.0 /100 | #34 | Exceptional 6.1% |
| Immigrants | Korea | 100.0 /100 | #35 | Exceptional 6.1% |
| Immigrants | Russia | 100.0 /100 | #36 | Exceptional 6.0% |
| Immigrants | Austria | 100.0 /100 | #37 | Exceptional 6.0% |
| Immigrants | Norway | 100.0 /100 | #38 | Exceptional 6.0% |
| Immigrants | South Africa | 100.0 /100 | #39 | Exceptional 6.0% |
| Cambodians | 100.0 /100 | #40 | Exceptional 6.0% |
Demographics Similar to Immigrants from Eastern Europe by Professional Degree
In terms of professional degree, the demographic groups most similar to Immigrants from Eastern Europe are Laotian (5.2%, a difference of 0.040%), Immigrants from Scotland (5.3%, a difference of 0.20%), Egyptian (5.3%, a difference of 0.30%), Chilean (5.3%, a difference of 0.30%), and Immigrants from Chile (5.3%, a difference of 0.44%).
| Demographics | Rating | Rank | Professional Degree |
| Immigrants | Zimbabwe | 99.6 /100 | #85 | Exceptional 5.3% |
| Greeks | 99.6 /100 | #86 | Exceptional 5.3% |
| Immigrants | Chile | 99.5 /100 | #87 | Exceptional 5.3% |
| Egyptians | 99.5 /100 | #88 | Exceptional 5.3% |
| Chileans | 99.5 /100 | #89 | Exceptional 5.3% |
| Immigrants | Scotland | 99.5 /100 | #90 | Exceptional 5.3% |
| Laotians | 99.5 /100 | #91 | Exceptional 5.2% |
| Immigrants | Eastern Europe | 99.5 /100 | #92 | Exceptional 5.2% |
| Northern Europeans | 99.3 /100 | #93 | Exceptional 5.2% |
| Alsatians | 99.3 /100 | #94 | Exceptional 5.2% |
| Zimbabweans | 99.3 /100 | #95 | Exceptional 5.2% |
| Immigrants | Uzbekistan | 99.2 /100 | #96 | Exceptional 5.2% |
| Syrians | 99.1 /100 | #97 | Exceptional 5.2% |
| Austrians | 99.1 /100 | #98 | Exceptional 5.2% |
| Immigrants | Italy | 99.1 /100 | #99 | Exceptional 5.2% |