Slovene vs Immigrants from Barbados Doctorate Degree
COMPARE
Slovene
Immigrants from Barbados
Doctorate Degree
Doctorate Degree Comparison
Slovenes
Immigrants from Barbados
1.9%
DOCTORATE DEGREE
70.2/ 100
METRIC RATING
159th/ 347
METRIC RANK
1.5%
DOCTORATE DEGREE
0.4/ 100
METRIC RATING
272nd/ 347
METRIC RANK
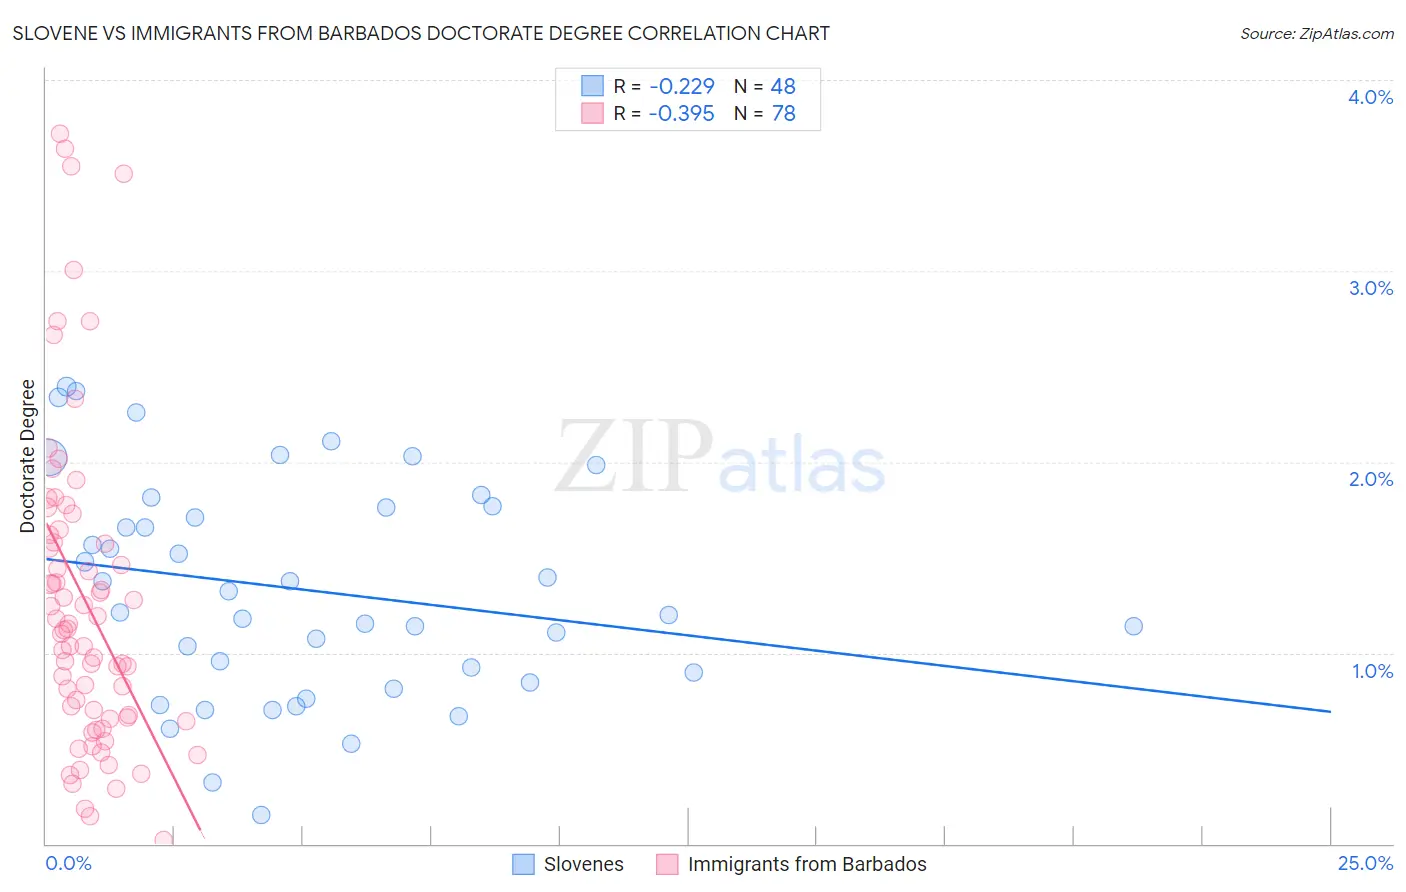
Slovene vs Immigrants from Barbados Doctorate Degree Correlation Chart
The statistical analysis conducted on geographies consisting of 259,569,588 people shows a weak negative correlation between the proportion of Slovenes and percentage of population with at least doctorate degree education in the United States with a correlation coefficient (R) of -0.229 and weighted average of 1.9%. Similarly, the statistical analysis conducted on geographies consisting of 112,445,982 people shows a mild negative correlation between the proportion of Immigrants from Barbados and percentage of population with at least doctorate degree education in the United States with a correlation coefficient (R) of -0.395 and weighted average of 1.5%, a difference of 28.6%.
Doctorate Degree Correlation Summary
| Measurement | Slovene | Immigrants from Barbados |
| Minimum | 0.15% | 0.017% |
| Maximum | 2.4% | 3.7% |
| Range | 2.2% | 3.7% |
| Mean | 1.3% | 1.3% |
| Median | 1.3% | 1.1% |
| Interquartile 25% (IQ1) | 0.87% | 0.66% |
| Interquartile 75% (IQ3) | 1.8% | 1.6% |
| Interquartile Range (IQR) | 0.89% | 0.96% |
| Standard Deviation (Sample) | 0.57% | 0.84% |
| Standard Deviation (Population) | 0.56% | 0.83% |
Similar Demographics by Doctorate Degree
Demographics Similar to Slovenes by Doctorate Degree
In terms of doctorate degree, the demographic groups most similar to Slovenes are Welsh (1.9%, a difference of 0.090%), Immigrants from Middle Africa (1.9%, a difference of 0.24%), Hungarian (1.9%, a difference of 0.26%), Danish (1.9%, a difference of 0.29%), and Slavic (1.9%, a difference of 0.37%).
| Demographics | Rating | Rank | Doctorate Degree |
| Immigrants | Kenya | 74.3 /100 | #152 | Good 1.9% |
| Immigrants | Oceania | 74.0 /100 | #153 | Good 1.9% |
| Immigrants | Albania | 72.8 /100 | #154 | Good 1.9% |
| Poles | 72.7 /100 | #155 | Good 1.9% |
| Slavs | 72.4 /100 | #156 | Good 1.9% |
| Danes | 71.9 /100 | #157 | Good 1.9% |
| Hungarians | 71.7 /100 | #158 | Good 1.9% |
| Slovenes | 70.2 /100 | #159 | Good 1.9% |
| Welsh | 69.7 /100 | #160 | Good 1.9% |
| Immigrants | Middle Africa | 68.8 /100 | #161 | Good 1.9% |
| Irish | 67.5 /100 | #162 | Good 1.9% |
| Czechs | 67.3 /100 | #163 | Good 1.9% |
| Celtics | 66.7 /100 | #164 | Good 1.9% |
| Scotch-Irish | 63.6 /100 | #165 | Good 1.9% |
| Spaniards | 63.5 /100 | #166 | Good 1.9% |
Demographics Similar to Immigrants from Barbados by Doctorate Degree
In terms of doctorate degree, the demographic groups most similar to Immigrants from Barbados are Immigrants from Trinidad and Tobago (1.5%, a difference of 0.090%), Sioux (1.5%, a difference of 0.11%), Yaqui (1.5%, a difference of 0.13%), Salvadoran (1.5%, a difference of 0.16%), and Crow (1.5%, a difference of 0.19%).
| Demographics | Rating | Rank | Doctorate Degree |
| Nicaraguans | 0.6 /100 | #265 | Tragic 1.5% |
| Immigrants | Liberia | 0.5 /100 | #266 | Tragic 1.5% |
| Kiowa | 0.5 /100 | #267 | Tragic 1.5% |
| U.S. Virgin Islanders | 0.5 /100 | #268 | Tragic 1.5% |
| Crow | 0.5 /100 | #269 | Tragic 1.5% |
| Salvadorans | 0.5 /100 | #270 | Tragic 1.5% |
| Immigrants | Trinidad and Tobago | 0.5 /100 | #271 | Tragic 1.5% |
| Immigrants | Barbados | 0.4 /100 | #272 | Tragic 1.5% |
| Sioux | 0.4 /100 | #273 | Tragic 1.5% |
| Yaqui | 0.4 /100 | #274 | Tragic 1.5% |
| Aleuts | 0.4 /100 | #275 | Tragic 1.5% |
| Paiute | 0.4 /100 | #276 | Tragic 1.5% |
| Bahamians | 0.4 /100 | #277 | Tragic 1.5% |
| Hawaiians | 0.4 /100 | #278 | Tragic 1.5% |
| Marshallese | 0.4 /100 | #279 | Tragic 1.5% |