Blackfeet vs Delaware College, 1 year or more
COMPARE
Blackfeet
Delaware
College, 1 year or more
College, 1 year or more Comparison
Blackfeet
Delaware
54.6%
COLLEGE, 1 YEAR OR MORE
0.2/ 100
METRIC RATING
267th/ 347
METRIC RANK
55.5%
COLLEGE, 1 YEAR OR MORE
0.7/ 100
METRIC RATING
250th/ 347
METRIC RANK
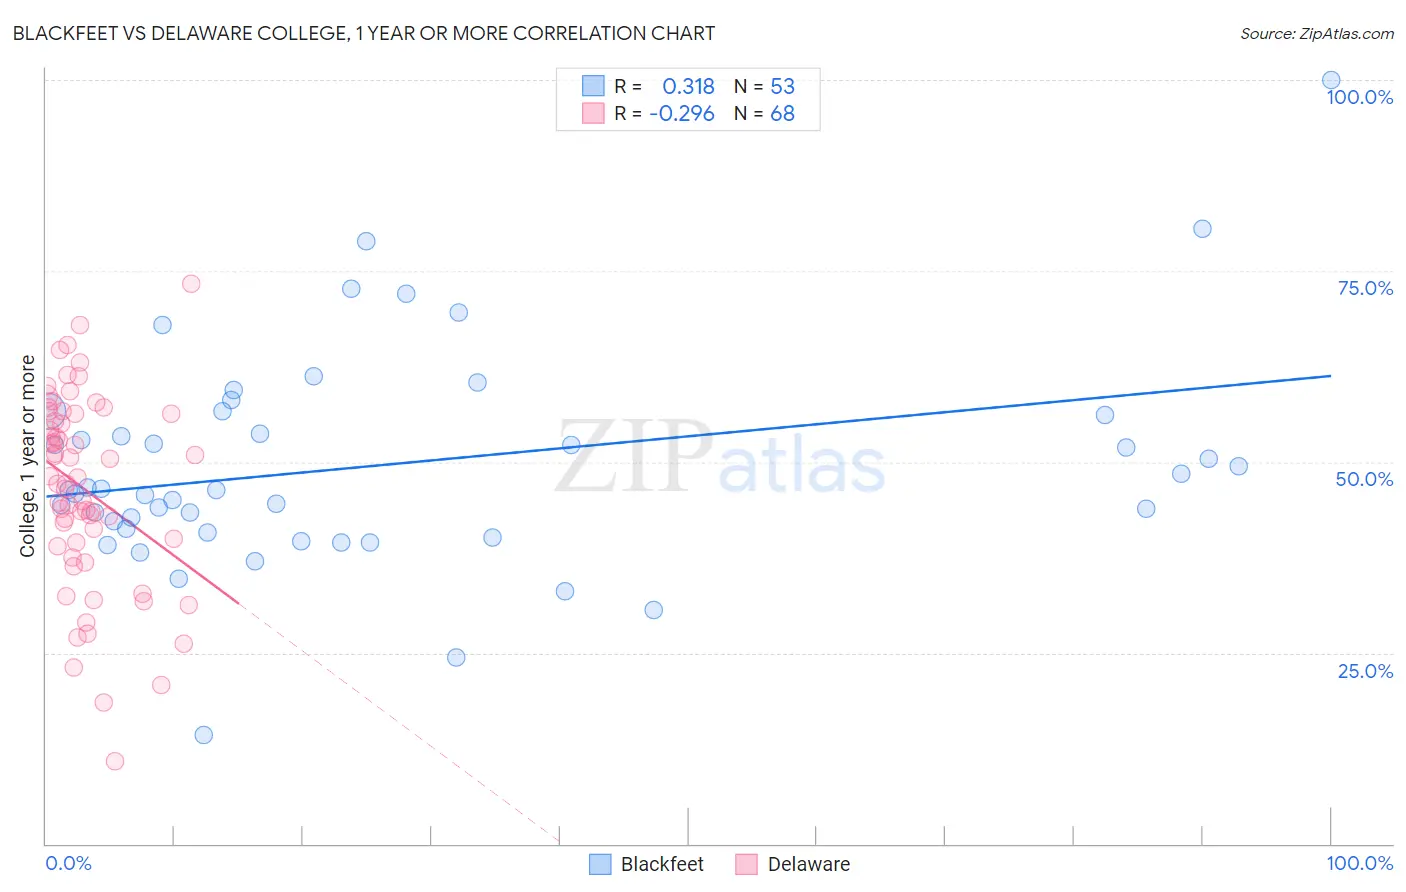
Blackfeet vs Delaware College, 1 year or more Correlation Chart
The statistical analysis conducted on geographies consisting of 309,581,710 people shows a mild positive correlation between the proportion of Blackfeet and percentage of population with at least college, 1 year or more education in the United States with a correlation coefficient (R) of 0.318 and weighted average of 54.6%. Similarly, the statistical analysis conducted on geographies consisting of 96,235,398 people shows a weak negative correlation between the proportion of Delaware and percentage of population with at least college, 1 year or more education in the United States with a correlation coefficient (R) of -0.296 and weighted average of 55.5%, a difference of 1.6%.
College, 1 year or more Correlation Summary
| Measurement | Blackfeet | Delaware |
| Minimum | 14.2% | 10.9% |
| Maximum | 100.0% | 73.3% |
| Range | 85.8% | 62.5% |
| Mean | 49.6% | 46.4% |
| Median | 46.3% | 47.6% |
| Interquartile 25% (IQ1) | 40.9% | 39.2% |
| Interquartile 75% (IQ3) | 56.4% | 56.3% |
| Interquartile Range (IQR) | 15.4% | 17.1% |
| Standard Deviation (Sample) | 14.4% | 12.7% |
| Standard Deviation (Population) | 14.3% | 12.6% |
Demographics Similar to Blackfeet and Delaware by College, 1 year or more
In terms of college, 1 year or more, the demographic groups most similar to Blackfeet are Potawatomi (54.6%, a difference of 0.070%), Immigrants from Laos (54.7%, a difference of 0.12%), British West Indian (54.5%, a difference of 0.16%), Immigrants from Micronesia (54.8%, a difference of 0.32%), and U.S. Virgin Islander (54.8%, a difference of 0.34%). Similarly, the demographic groups most similar to Delaware are Immigrants from Trinidad and Tobago (55.5%, a difference of 0.020%), Immigrants from Cambodia (55.4%, a difference of 0.090%), Immigrants from Congo (55.6%, a difference of 0.12%), Aleut (55.4%, a difference of 0.12%), and Immigrants from Barbados (55.4%, a difference of 0.23%).
| Demographics | Rating | Rank | College, 1 year or more |
| Immigrants | Congo | 0.8 /100 | #248 | Tragic 55.6% |
| Immigrants | Trinidad and Tobago | 0.7 /100 | #249 | Tragic 55.5% |
| Delaware | 0.7 /100 | #250 | Tragic 55.5% |
| Immigrants | Cambodia | 0.6 /100 | #251 | Tragic 55.4% |
| Aleuts | 0.6 /100 | #252 | Tragic 55.4% |
| Immigrants | Barbados | 0.6 /100 | #253 | Tragic 55.4% |
| Japanese | 0.5 /100 | #254 | Tragic 55.2% |
| Immigrants | Bahamas | 0.5 /100 | #255 | Tragic 55.2% |
| Immigrants | West Indies | 0.5 /100 | #256 | Tragic 55.2% |
| Indonesians | 0.4 /100 | #257 | Tragic 55.1% |
| Africans | 0.4 /100 | #258 | Tragic 55.0% |
| Nepalese | 0.3 /100 | #259 | Tragic 54.9% |
| Jamaicans | 0.3 /100 | #260 | Tragic 54.9% |
| Ottawa | 0.3 /100 | #261 | Tragic 54.9% |
| Immigrants | St. Vincent and the Grenadines | 0.3 /100 | #262 | Tragic 54.8% |
| U.S. Virgin Islanders | 0.3 /100 | #263 | Tragic 54.8% |
| Immigrants | Micronesia | 0.3 /100 | #264 | Tragic 54.8% |
| Immigrants | Laos | 0.2 /100 | #265 | Tragic 54.7% |
| Potawatomi | 0.2 /100 | #266 | Tragic 54.6% |
| Blackfeet | 0.2 /100 | #267 | Tragic 54.6% |
| British West Indians | 0.2 /100 | #268 | Tragic 54.5% |