Immigrants from Austria vs Delaware College, 1 year or more
COMPARE
Immigrants from Austria
Delaware
College, 1 year or more
College, 1 year or more Comparison
Immigrants from Austria
Delaware
64.4%
COLLEGE, 1 YEAR OR MORE
99.8/ 100
METRIC RATING
50th/ 347
METRIC RANK
55.5%
COLLEGE, 1 YEAR OR MORE
0.7/ 100
METRIC RATING
250th/ 347
METRIC RANK
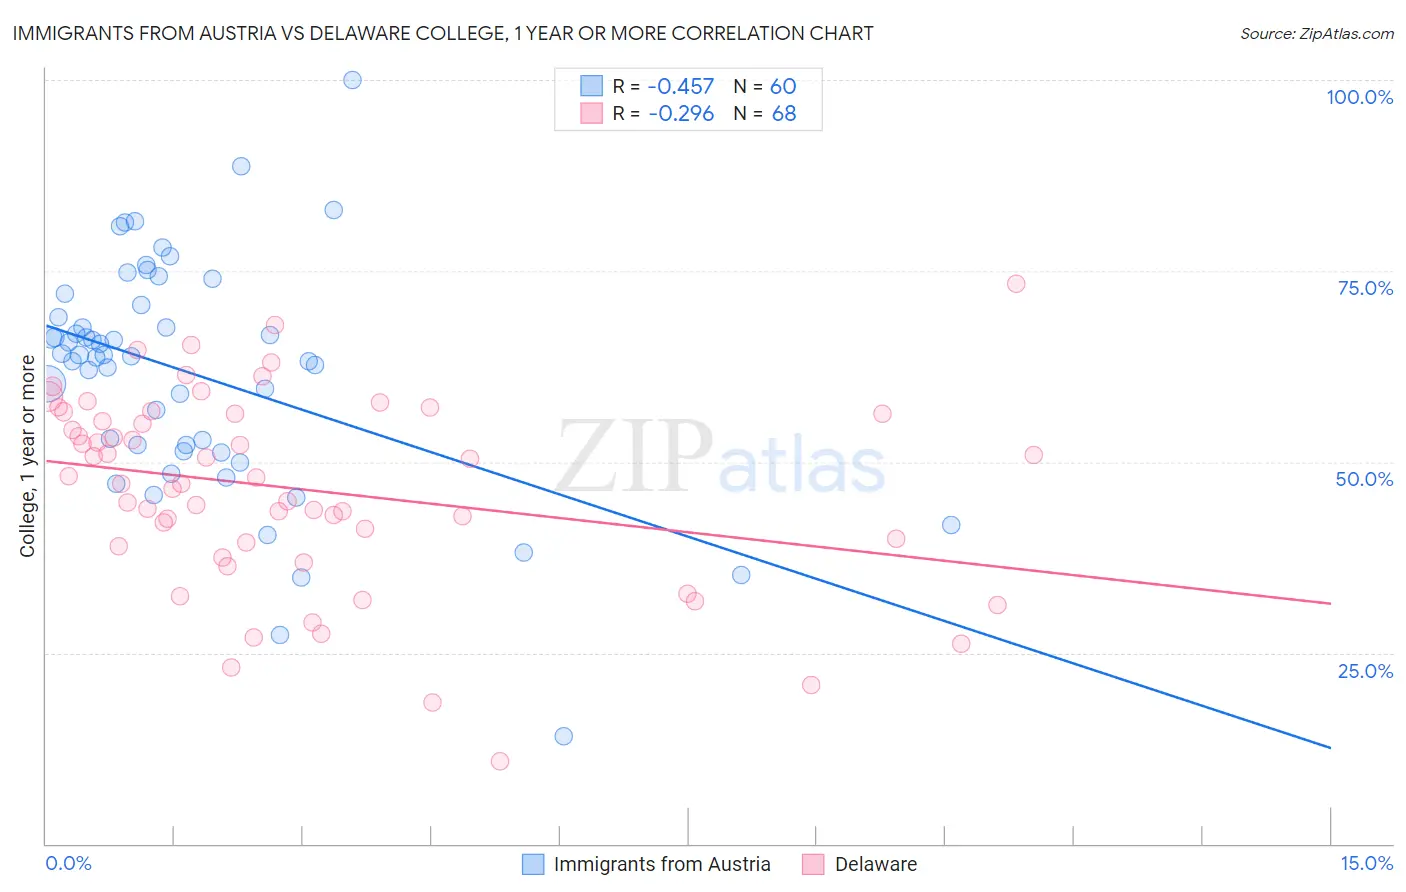
Immigrants from Austria vs Delaware College, 1 year or more Correlation Chart
The statistical analysis conducted on geographies consisting of 167,973,933 people shows a moderate negative correlation between the proportion of Immigrants from Austria and percentage of population with at least college, 1 year or more education in the United States with a correlation coefficient (R) of -0.457 and weighted average of 64.4%. Similarly, the statistical analysis conducted on geographies consisting of 96,235,398 people shows a weak negative correlation between the proportion of Delaware and percentage of population with at least college, 1 year or more education in the United States with a correlation coefficient (R) of -0.296 and weighted average of 55.5%, a difference of 16.0%.
College, 1 year or more Correlation Summary
| Measurement | Immigrants from Austria | Delaware |
| Minimum | 14.1% | 10.9% |
| Maximum | 100.0% | 73.3% |
| Range | 85.9% | 62.5% |
| Mean | 61.4% | 46.4% |
| Median | 63.9% | 47.6% |
| Interquartile 25% (IQ1) | 51.8% | 39.2% |
| Interquartile 75% (IQ3) | 69.7% | 56.3% |
| Interquartile Range (IQR) | 17.9% | 17.1% |
| Standard Deviation (Sample) | 15.3% | 12.7% |
| Standard Deviation (Population) | 15.1% | 12.6% |
Similar Demographics by College, 1 year or more
Demographics Similar to Immigrants from Austria by College, 1 year or more
In terms of college, 1 year or more, the demographic groups most similar to Immigrants from Austria are Immigrants from Malaysia (64.3%, a difference of 0.080%), Immigrants from Netherlands (64.2%, a difference of 0.24%), Asian (64.2%, a difference of 0.26%), New Zealander (64.6%, a difference of 0.29%), and Zimbabwean (64.2%, a difference of 0.29%).
| Demographics | Rating | Rank | College, 1 year or more |
| Immigrants | Russia | 99.9 /100 | #43 | Exceptional 64.7% |
| Immigrants | Norway | 99.9 /100 | #44 | Exceptional 64.7% |
| Immigrants | Lithuania | 99.9 /100 | #45 | Exceptional 64.6% |
| Bhutanese | 99.9 /100 | #46 | Exceptional 64.6% |
| Australians | 99.9 /100 | #47 | Exceptional 64.6% |
| Immigrants | Bulgaria | 99.9 /100 | #48 | Exceptional 64.6% |
| New Zealanders | 99.9 /100 | #49 | Exceptional 64.6% |
| Immigrants | Austria | 99.8 /100 | #50 | Exceptional 64.4% |
| Immigrants | Malaysia | 99.8 /100 | #51 | Exceptional 64.3% |
| Immigrants | Netherlands | 99.8 /100 | #52 | Exceptional 64.2% |
| Asians | 99.8 /100 | #53 | Exceptional 64.2% |
| Zimbabweans | 99.8 /100 | #54 | Exceptional 64.2% |
| Immigrants | Belarus | 99.7 /100 | #55 | Exceptional 64.1% |
| Immigrants | Czechoslovakia | 99.7 /100 | #56 | Exceptional 64.1% |
| South Africans | 99.7 /100 | #57 | Exceptional 64.1% |
Demographics Similar to Delaware by College, 1 year or more
In terms of college, 1 year or more, the demographic groups most similar to Delaware are Immigrants from Trinidad and Tobago (55.5%, a difference of 0.020%), Immigrants from Cambodia (55.4%, a difference of 0.090%), Immigrants from Congo (55.6%, a difference of 0.12%), Aleut (55.4%, a difference of 0.12%), and Hawaiian (55.6%, a difference of 0.16%).
| Demographics | Rating | Rank | College, 1 year or more |
| Osage | 1.0 /100 | #243 | Tragic 55.8% |
| Chippewa | 0.9 /100 | #244 | Tragic 55.7% |
| Immigrants | Liberia | 0.8 /100 | #245 | Tragic 55.7% |
| Malaysians | 0.8 /100 | #246 | Tragic 55.6% |
| Hawaiians | 0.8 /100 | #247 | Tragic 55.6% |
| Immigrants | Congo | 0.8 /100 | #248 | Tragic 55.6% |
| Immigrants | Trinidad and Tobago | 0.7 /100 | #249 | Tragic 55.5% |
| Delaware | 0.7 /100 | #250 | Tragic 55.5% |
| Immigrants | Cambodia | 0.6 /100 | #251 | Tragic 55.4% |
| Aleuts | 0.6 /100 | #252 | Tragic 55.4% |
| Immigrants | Barbados | 0.6 /100 | #253 | Tragic 55.4% |
| Japanese | 0.5 /100 | #254 | Tragic 55.2% |
| Immigrants | Bahamas | 0.5 /100 | #255 | Tragic 55.2% |
| Immigrants | West Indies | 0.5 /100 | #256 | Tragic 55.2% |
| Indonesians | 0.4 /100 | #257 | Tragic 55.1% |