Bermudan vs Hungarian GED/Equivalency
COMPARE
Bermudan
Hungarian
GED/Equivalency
GED/Equivalency Comparison
Bermudans
Hungarians
85.8%
GED/EQUIVALENCY
55.1/ 100
METRIC RATING
172nd/ 347
METRIC RANK
87.4%
GED/EQUIVALENCY
97.9/ 100
METRIC RATING
89th/ 347
METRIC RANK
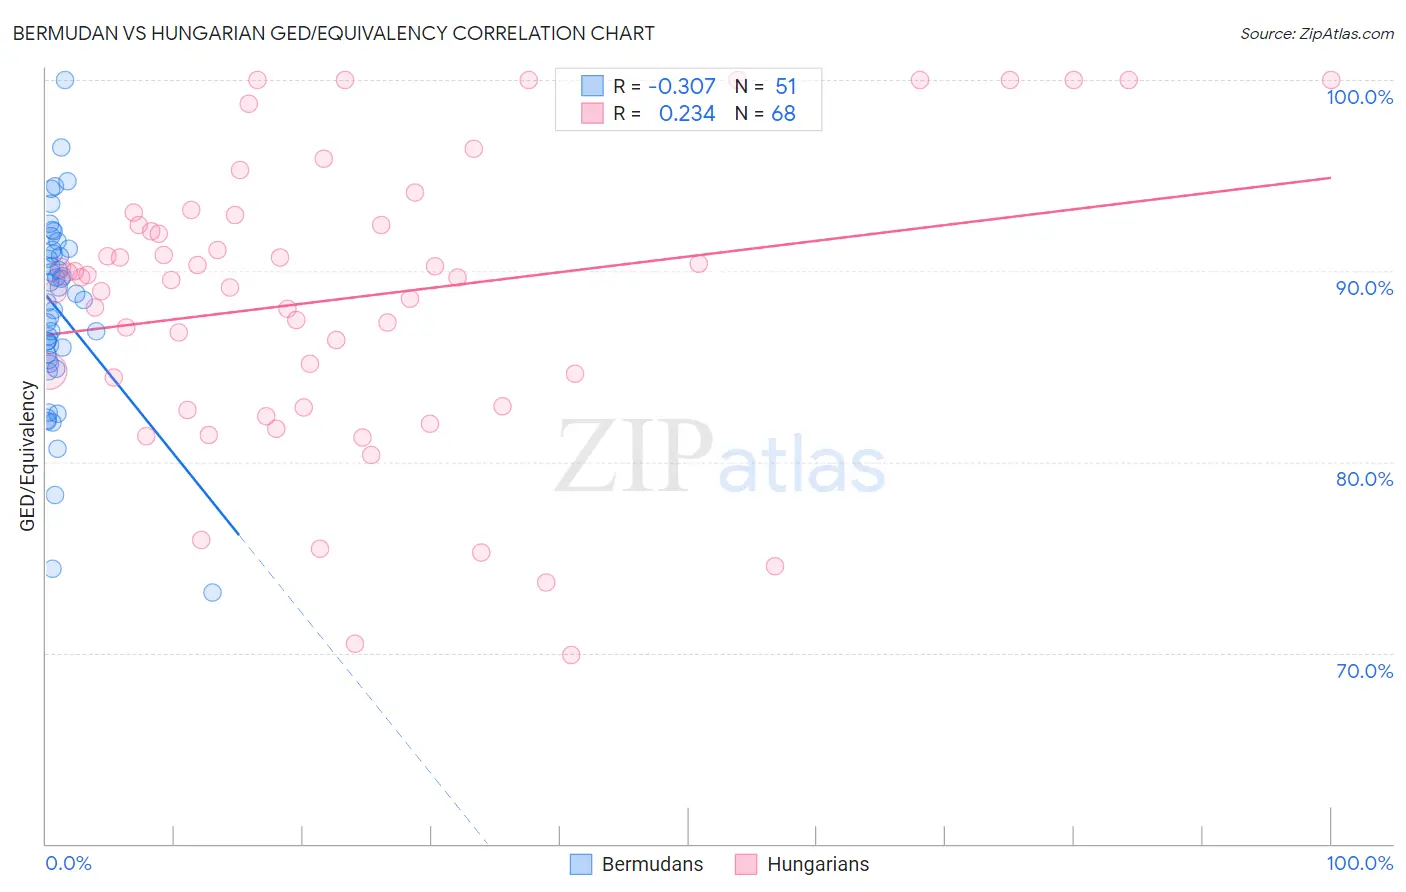
Bermudan vs Hungarian GED/Equivalency Correlation Chart
The statistical analysis conducted on geographies consisting of 55,728,561 people shows a mild negative correlation between the proportion of Bermudans and percentage of population with at least ged/equivalency education in the United States with a correlation coefficient (R) of -0.307 and weighted average of 85.8%. Similarly, the statistical analysis conducted on geographies consisting of 486,240,766 people shows a weak positive correlation between the proportion of Hungarians and percentage of population with at least ged/equivalency education in the United States with a correlation coefficient (R) of 0.234 and weighted average of 87.4%, a difference of 1.9%.
GED/Equivalency Correlation Summary
| Measurement | Bermudan | Hungarian |
| Minimum | 73.2% | 69.9% |
| Maximum | 100.0% | 100.0% |
| Range | 26.8% | 30.1% |
| Mean | 87.9% | 88.6% |
| Median | 88.5% | 89.6% |
| Interquartile 25% (IQ1) | 85.3% | 83.7% |
| Interquartile 75% (IQ3) | 91.1% | 92.7% |
| Interquartile Range (IQR) | 5.8% | 9.0% |
| Standard Deviation (Sample) | 5.1% | 7.5% |
| Standard Deviation (Population) | 5.0% | 7.4% |
Similar Demographics by GED/Equivalency
Demographics Similar to Bermudans by GED/Equivalency
In terms of ged/equivalency, the demographic groups most similar to Bermudans are Immigrants from Chile (85.9%, a difference of 0.050%), Immigrants from Venezuela (85.8%, a difference of 0.090%), Afghan (85.9%, a difference of 0.10%), Ottawa (85.8%, a difference of 0.10%), and Immigrants from Bolivia (85.8%, a difference of 0.11%).
| Demographics | Rating | Rank | GED/Equivalency |
| Alsatians | 64.3 /100 | #165 | Good 86.0% |
| Immigrants | Albania | 64.2 /100 | #166 | Good 86.0% |
| Ethiopians | 63.7 /100 | #167 | Good 86.0% |
| Sierra Leoneans | 61.8 /100 | #168 | Good 86.0% |
| Immigrants | Ethiopia | 61.2 /100 | #169 | Good 86.0% |
| Afghans | 59.7 /100 | #170 | Average 85.9% |
| Immigrants | Chile | 57.3 /100 | #171 | Average 85.9% |
| Bermudans | 55.1 /100 | #172 | Average 85.8% |
| Immigrants | Venezuela | 50.7 /100 | #173 | Average 85.8% |
| Ottawa | 50.0 /100 | #174 | Average 85.8% |
| Immigrants | Bolivia | 49.8 /100 | #175 | Average 85.8% |
| Immigrants | Eastern Africa | 47.7 /100 | #176 | Average 85.7% |
| Immigrants | Uganda | 45.2 /100 | #177 | Average 85.7% |
| Koreans | 41.2 /100 | #178 | Average 85.6% |
| Aleuts | 40.5 /100 | #179 | Average 85.6% |
Demographics Similar to Hungarians by GED/Equivalency
In terms of ged/equivalency, the demographic groups most similar to Hungarians are Welsh (87.4%, a difference of 0.0%), Immigrants from Eastern Asia (87.4%, a difference of 0.010%), Israeli (87.4%, a difference of 0.020%), Immigrants from North Macedonia (87.4%, a difference of 0.030%), and Immigrants from Russia (87.4%, a difference of 0.030%).
| Demographics | Rating | Rank | GED/Equivalency |
| Romanians | 98.3 /100 | #82 | Exceptional 87.5% |
| South Africans | 98.3 /100 | #83 | Exceptional 87.5% |
| Immigrants | Romania | 98.1 /100 | #84 | Exceptional 87.5% |
| Dutch | 98.1 /100 | #85 | Exceptional 87.5% |
| Immigrants | Europe | 98.1 /100 | #86 | Exceptional 87.5% |
| Native Hawaiians | 98.1 /100 | #87 | Exceptional 87.5% |
| Immigrants | Norway | 98.1 /100 | #88 | Exceptional 87.5% |
| Hungarians | 97.9 /100 | #89 | Exceptional 87.4% |
| Welsh | 97.9 /100 | #90 | Exceptional 87.4% |
| Immigrants | Eastern Asia | 97.9 /100 | #91 | Exceptional 87.4% |
| Israelis | 97.8 /100 | #92 | Exceptional 87.4% |
| Immigrants | North Macedonia | 97.8 /100 | #93 | Exceptional 87.4% |
| Immigrants | Russia | 97.8 /100 | #94 | Exceptional 87.4% |
| Immigrants | Greece | 97.7 /100 | #95 | Exceptional 87.4% |
| Czechoslovakians | 97.6 /100 | #96 | Exceptional 87.4% |