Basque vs Swiss Associate's Degree
COMPARE
Basque
Swiss
Associate's Degree
Associate's Degree Comparison
Basques
Swiss
46.5%
ASSOCIATE'S DEGREE
52.8/ 100
METRIC RATING
171st/ 347
METRIC RANK
46.0%
ASSOCIATE'S DEGREE
40.4/ 100
METRIC RATING
182nd/ 347
METRIC RANK
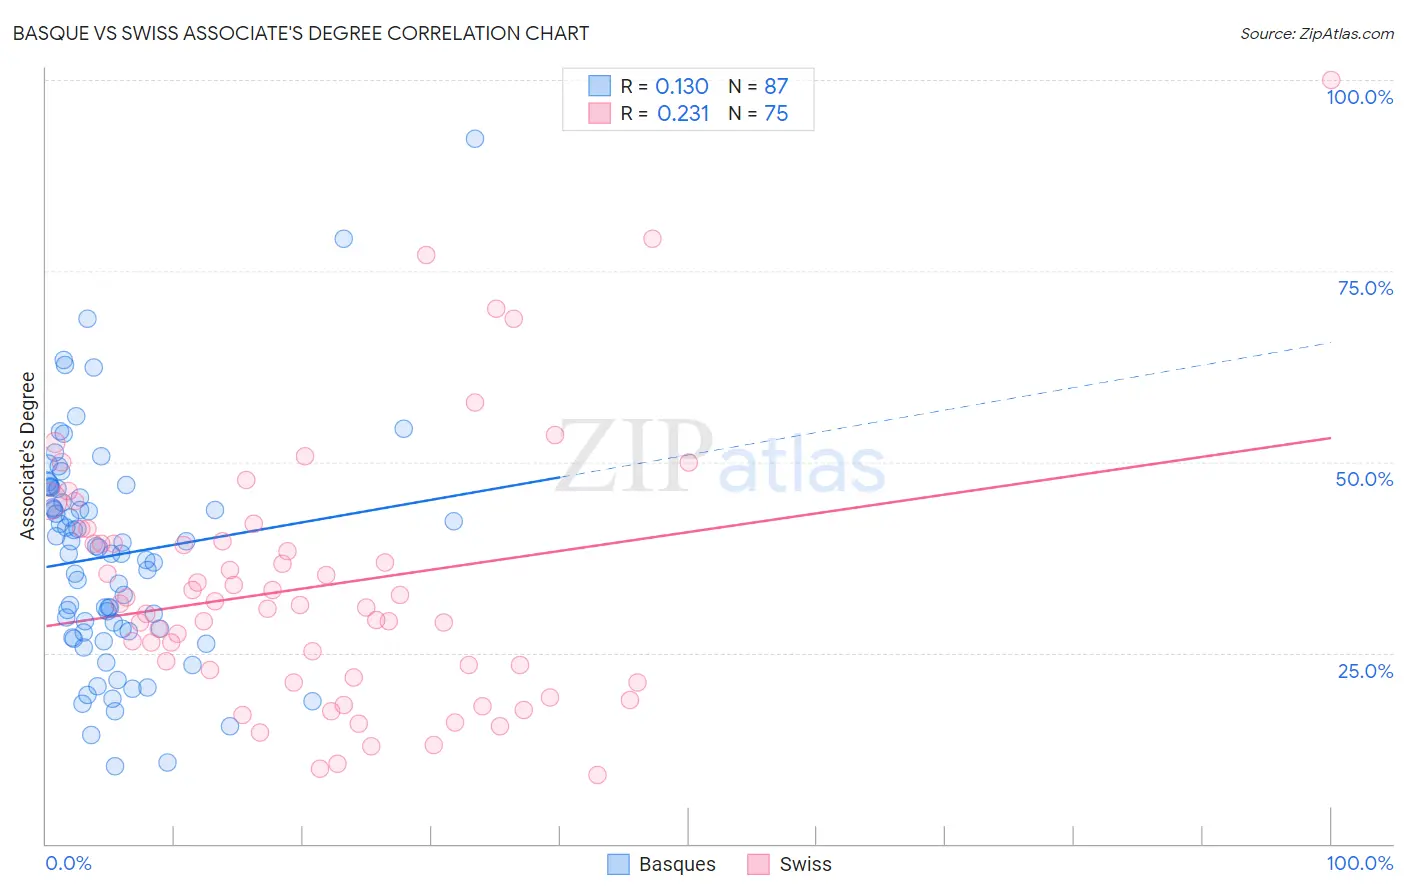
Basque vs Swiss Associate's Degree Correlation Chart
The statistical analysis conducted on geographies consisting of 165,778,580 people shows a poor positive correlation between the proportion of Basques and percentage of population with at least associate's degree education in the United States with a correlation coefficient (R) of 0.130 and weighted average of 46.5%. Similarly, the statistical analysis conducted on geographies consisting of 464,994,440 people shows a weak positive correlation between the proportion of Swiss and percentage of population with at least associate's degree education in the United States with a correlation coefficient (R) of 0.231 and weighted average of 46.0%, a difference of 0.95%.
Associate's Degree Correlation Summary
| Measurement | Basque | Swiss |
| Minimum | 10.2% | 8.9% |
| Maximum | 92.3% | 100.0% |
| Range | 82.1% | 91.1% |
| Mean | 37.8% | 33.6% |
| Median | 38.0% | 31.2% |
| Interquartile 25% (IQ1) | 27.9% | 21.8% |
| Interquartile 75% (IQ3) | 46.5% | 39.6% |
| Interquartile Range (IQR) | 18.6% | 17.8% |
| Standard Deviation (Sample) | 14.5% | 16.9% |
| Standard Deviation (Population) | 14.4% | 16.8% |
Demographics Similar to Basques and Swiss by Associate's Degree
In terms of associate's degree, the demographic groups most similar to Basques are Irish (46.5%, a difference of 0.060%), Peruvian (46.4%, a difference of 0.18%), Uruguayan (46.5%, a difference of 0.19%), Immigrants from Iraq (46.4%, a difference of 0.19%), and Immigrants from Somalia (46.5%, a difference of 0.20%). Similarly, the demographic groups most similar to Swiss are Yugoslavian (46.0%, a difference of 0.010%), Czechoslovakian (46.0%, a difference of 0.030%), Immigrants from Colombia (46.0%, a difference of 0.070%), Costa Rican (46.0%, a difference of 0.14%), and Welsh (45.9%, a difference of 0.20%).
| Demographics | Rating | Rank | Associate's Degree |
| Hungarians | 59.3 /100 | #166 | Average 46.7% |
| Immigrants | Sierra Leone | 59.2 /100 | #167 | Average 46.7% |
| Immigrants | Somalia | 55.5 /100 | #168 | Average 46.5% |
| Uruguayans | 55.4 /100 | #169 | Average 46.5% |
| Irish | 53.6 /100 | #170 | Average 46.5% |
| Basques | 52.8 /100 | #171 | Average 46.5% |
| Peruvians | 50.5 /100 | #172 | Average 46.4% |
| Immigrants | Iraq | 50.3 /100 | #173 | Average 46.4% |
| English | 50.0 /100 | #174 | Average 46.4% |
| Belgians | 48.9 /100 | #175 | Average 46.3% |
| Finns | 48.5 /100 | #176 | Average 46.3% |
| Slovaks | 48.4 /100 | #177 | Average 46.3% |
| Immigrants | Bosnia and Herzegovina | 48.3 /100 | #178 | Average 46.3% |
| Sri Lankans | 47.6 /100 | #179 | Average 46.3% |
| Bermudans | 46.4 /100 | #180 | Average 46.2% |
| Immigrants | Colombia | 41.3 /100 | #181 | Average 46.0% |
| Swiss | 40.4 /100 | #182 | Average 46.0% |
| Yugoslavians | 40.2 /100 | #183 | Average 46.0% |
| Czechoslovakians | 40.0 /100 | #184 | Average 46.0% |
| Costa Ricans | 38.6 /100 | #185 | Fair 46.0% |
| Welsh | 37.9 /100 | #186 | Fair 45.9% |