Basque vs Immigrants from Bulgaria Associate's Degree

COMPARE

Basque
Race
Ancestry
AfghanAfricanAlaska NativeAlaskan AthabascanAlbanianAleutAlsatianAmericanApacheArabArapahoArgentineanArmenianAssyrian/Chaldean/SyriacAustralianAustrianBahamianBangladeshiBarbadianBasqueBelgianBelizeanBermudanBhutaneseBlackfeetBolivianBrazilianBritishBritish West IndianBulgarianBurmeseCajunCambodianCanadianCape VerdeanCarpatho RusynCelticCentral AmericanCentral American IndianCherokeeCheyenneChickasawChileanChineseChippewaChoctawColombianColvilleComancheCosta RicanCreeCreekCroatianCrowCubanCypriotCzechCzechoslovakianDanishDelawareDominicanDutchDutch West IndianEastern EuropeanEcuadorianEgyptianEnglishEstonianEthiopianEuropeanFijianFilipinoFinnishFrenchFrench American IndianFrench CanadianGermanGerman RussianGhanaianGreekGuamanian/ChamorroGuatemalanGuyaneseHaitianHmongHonduranHopiHoumaHungarianIcelanderIndian (Asian)IndonesianInupiatIranianIraqiIrishIroquoisIsraeliItalianJamaicanJapaneseJordanianKenyanKiowaKoreanLaotianLatvianLebaneseLiberianLithuanianLumbeeLuxembourgerMacedonianMalaysianMalteseMarshalleseMenomineeMexicanMexican American IndianMongolianMoroccanNative HawaiianNavajoNepaleseNew ZealanderNicaraguanNigerianNorthern EuropeanNorwegianOkinawanOsageOttawaPaiutePakistaniPalestinianPanamanianParaguayanPennsylvania GermanPeruvianPimaPolishPortuguesePotawatomiPuebloPuerto RicanPuget Sound SalishRomanianRussianSalvadoranSamoanScandinavianScotch-IrishScottishSeminoleSenegaleseSerbianShoshoneSierra LeoneanSiouxSlavicSlovakSloveneSomaliSouth AfricanSouth AmericanSouth American IndianSoviet UnionSpaniardSpanishSpanish AmericanSpanish American IndianSri LankanSubsaharan AfricanSudaneseSwedishSwissSyrianTaiwaneseThaiTlingit-HaidaTohono O'OdhamTonganTrinidadian and TobagonianTsimshianTurkishU.S. Virgin IslanderUgandanUkrainianUruguayanUteVenezuelanVietnameseWelshWest IndianYakamaYaquiYugoslavianYumanYup'ikZimbabwean
Immigration
NonimmigrantsImmigrantsAfghanistanAfricaAlbaniaArgentinaArmeniaAsiaAustraliaAustriaBahamasBangladeshBarbadosBelarusBelgiumBelizeBoliviaBosnia and HerzegovinaBrazilBurma/MyanmarCabo VerdeCambodiaCameroonCanadaCaribbeanCentral AmericaChileChinaColombiaCongoCosta RicaCroatiaCubaCzechoslovakiaDenmarkDominicaDominican RepublicEastern AfricaEastern AsiaEastern EuropeEcuadorEgyptEl SalvadorEnglandEritreaEthiopiaEuropeFijiFranceGermanyGhanaGreeceGrenadaGuatemalaGuyanaHaitiHondurasHong KongHungaryIndiaIndonesiaIranIraqIrelandIsraelItalyJamaicaJapanJordanKazakhstanKenyaKoreaKuwaitLaosLatin AmericaLatviaLebanonLiberiaLithuaniaMalaysiaMexicoMicronesiaMiddle AfricaMoldovaMoroccoNepalNetherlandsNicaraguaNigeriaNorth AmericaNorth MacedoniaNorthern AfricaNorthern EuropeNorwayOceaniaPakistanPanamaPeruPhilippinesPolandPortugalRomaniaRussiaSaudi ArabiaScotlandSenegalSerbiaSierra LeoneSingaporeSomaliaSouth AfricaSouth AmericaSouth Central AsiaSouth Eastern AsiaSouthern EuropeSpainSri LankaSt. Vincent and the GrenadinesSudanSwedenSwitzerlandSyriaTaiwanThailandTrinidad and TobagoTurkeyUgandaUkraineUruguayUzbekistanVenezuelaVietnamWest IndiesWestern AfricaWestern AsiaWestern EuropeYemenZaireZimbabweAzores
Immigrants from Bulgaria
Race
Ancestry
AfghanAfricanAlaska NativeAlaskan AthabascanAlbanianAleutAlsatianAmericanApacheArabArapahoArgentineanArmenianAssyrian/Chaldean/SyriacAustralianAustrianBahamianBangladeshiBarbadianBelgianBelizeanBermudanBhutaneseBlackfeetBolivianBrazilianBritishBritish West IndianBulgarianBurmeseCajunCambodianCanadianCape VerdeanCarpatho RusynCelticCentral AmericanCentral American IndianCherokeeCheyenneChickasawChileanChineseChippewaChoctawColombianColvilleComancheCosta RicanCreeCreekCroatianCrowCubanCypriotCzechCzechoslovakianDanishDelawareDominicanDutchDutch West IndianEastern EuropeanEcuadorianEgyptianEnglishEstonianEthiopianEuropeanFijianFilipinoFinnishFrenchFrench American IndianFrench CanadianGermanGerman RussianGhanaianGreekGuamanian/ChamorroGuatemalanGuyaneseHaitianHmongHonduranHopiHoumaHungarianIcelanderIndian (Asian)IndonesianInupiatIranianIraqiIrishIroquoisIsraeliItalianJamaicanJapaneseJordanianKenyanKiowaKoreanLaotianLatvianLebaneseLiberianLithuanianLumbeeLuxembourgerMacedonianMalaysianMalteseMarshalleseMenomineeMexicanMexican American IndianMongolianMoroccanNative HawaiianNavajoNepaleseNew ZealanderNicaraguanNigerianNorthern EuropeanNorwegianOkinawanOsageOttawaPaiutePakistaniPalestinianPanamanianParaguayanPennsylvania GermanPeruvianPimaPolishPortuguesePotawatomiPuebloPuerto RicanPuget Sound SalishRomanianRussianSalvadoranSamoanScandinavianScotch-IrishScottishSeminoleSenegaleseSerbianShoshoneSierra LeoneanSiouxSlavicSlovakSloveneSomaliSouth AfricanSouth AmericanSouth American IndianSoviet UnionSpaniardSpanishSpanish AmericanSpanish American IndianSri LankanSubsaharan AfricanSudaneseSwedishSwissSyrianTaiwaneseThaiTlingit-HaidaTohono O'OdhamTonganTrinidadian and TobagonianTsimshianTurkishU.S. Virgin IslanderUgandanUkrainianUruguayanUteVenezuelanVietnameseWelshWest IndianYakamaYaquiYugoslavianYumanYup'ikZimbabwean
Immigration
NonimmigrantsImmigrantsAfghanistanAfricaAlbaniaArgentinaArmeniaAsiaAustraliaAustriaBahamasBangladeshBarbadosBelarusBelgiumBelizeBoliviaBosnia and HerzegovinaBrazilBulgariaBurma/MyanmarCabo VerdeCambodiaCameroonCanadaCaribbeanCentral AmericaChileChinaColombiaCongoCosta RicaCroatiaCubaCzechoslovakiaDenmarkDominicaDominican RepublicEastern AfricaEastern AsiaEastern EuropeEcuadorEgyptEl SalvadorEnglandEritreaEthiopiaEuropeFijiFranceGermanyGhanaGreeceGrenadaGuatemalaGuyanaHaitiHondurasHong KongHungaryIndiaIndonesiaIranIraqIrelandIsraelItalyJamaicaJapanJordanKazakhstanKenyaKoreaKuwaitLaosLatin AmericaLatviaLebanonLiberiaLithuaniaMalaysiaMexicoMicronesiaMiddle AfricaMoldovaMoroccoNepalNetherlandsNicaraguaNigeriaNorth AmericaNorth MacedoniaNorthern AfricaNorthern EuropeNorwayOceaniaPakistanPanamaPeruPhilippinesPolandPortugalRomaniaRussiaSaudi ArabiaScotlandSenegalSerbiaSierra LeoneSingaporeSomaliaSouth AfricaSouth AmericaSouth Central AsiaSouth Eastern AsiaSouthern EuropeSpainSri LankaSt. Vincent and the GrenadinesSudanSwedenSwitzerlandSyriaTaiwanThailandTrinidad and TobagoTurkeyUgandaUkraineUruguayUzbekistanVenezuelaVietnamWest IndiesWestern AfricaWestern AsiaWestern EuropeYemenZaireZimbabweAzores
Associate's Degree
Income
Poverty
Unemployment
Labor Participation
Family Structure
Vehicle Availability
Education Level
Disability

Associate's Degree Comparison

Basques

Immigrants from Bulgaria

Average
Exceptional
46.5%
ASSOCIATE'S DEGREE
52.8/ 100
METRIC RATING
171st/ 347
METRIC RANK
52.4%
ASSOCIATE'S DEGREE
99.9/ 100
METRIC RATING
46th/ 347
METRIC RANK

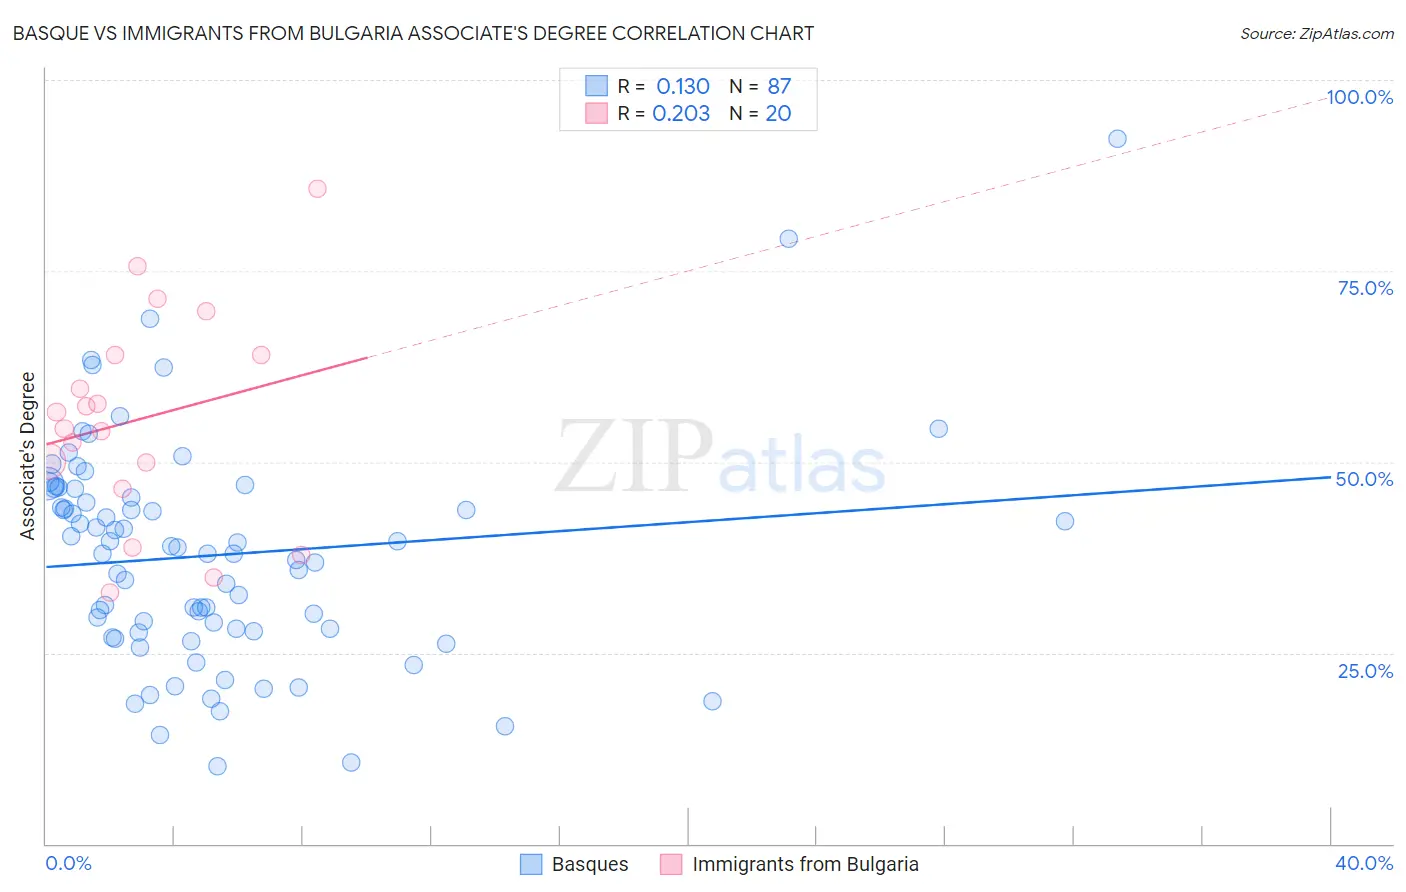
Basque vs Immigrants from Bulgaria Associate's Degree Correlation Chart

The statistical analysis conducted on geographies consisting of 165,778,580 people shows a poor positive correlation between the proportion of Basques and percentage of population with at least associate's degree education in the United States with a correlation coefficient (R) of 0.130 and weighted average of 46.5%. Similarly, the statistical analysis conducted on geographies consisting of 172,549,252 people shows a weak positive correlation between the proportion of Immigrants from Bulgaria and percentage of population with at least associate's degree education in the United States with a correlation coefficient (R) of 0.203 and weighted average of 52.4%, a difference of 12.8%.
Basque vs Immigrants from Bulgaria Associate's Degree

Associate's Degree Correlation Summary

MeasurementBasqueImmigrants from Bulgaria
Minimum10.2%32.8%
Maximum92.3%85.8%
Range82.1%52.9%
Mean37.8%55.7%
Median38.0%55.5%
Interquartile 25% (IQ1)27.9%48.2%
Interquartile 75% (IQ3)46.5%64.0%
Interquartile Range (IQR)18.6%15.8%
Standard Deviation (Sample)14.5%13.8%
Standard Deviation (Population)14.4%13.5%

Similar Demographics by Associate's Degree

Demographics Similar to Basques by Associate's Degree

In terms of associate's degree, the demographic groups most similar to Basques are Irish (46.5%, a difference of 0.060%), Peruvian (46.4%, a difference of 0.18%), Uruguayan (46.5%, a difference of 0.19%), Immigrants from Iraq (46.4%, a difference of 0.19%), and Immigrants from Somalia (46.5%, a difference of 0.20%).
DemographicsRating | RankAssociate's Degree
Colombians
62.4
/100
|
#164
Good
46.8%
Immigrants | South America
59.9
/100
|
#165
Average
46.7%
Hungarians
59.3
/100
|
#166
Average
46.7%
Immigrants | Sierra Leone
59.2
/100
|
#167
Average
46.7%
Immigrants | Somalia
55.5
/100
|
#168
Average
46.5%
Uruguayans
55.4
/100
|
#169
Average
46.5%
Irish
53.6
/100
|
#170
Average
46.5%
Basques
52.8
/100
|
#171
Average
46.5%
Peruvians
50.5
/100
|
#172
Average
46.4%
Immigrants | Iraq
50.3
/100
|
#173
Average
46.4%
English
50.0
/100
|
#174
Average
46.4%
Belgians
48.9
/100
|
#175
Average
46.3%
Finns
48.5
/100
|
#176
Average
46.3%
Slovaks
48.4
/100
|
#177
Average
46.3%
Immigrants | Bosnia and Herzegovina
48.3
/100
|
#178
Average
46.3%

Demographics Similar to Immigrants from Bulgaria by Associate's Degree

In terms of associate's degree, the demographic groups most similar to Immigrants from Bulgaria are Immigrants from Kuwait (52.4%, a difference of 0.010%), Immigrants from Lithuania (52.4%, a difference of 0.13%), Estonian (52.5%, a difference of 0.21%), Immigrants from Norway (52.2%, a difference of 0.27%), and Immigrants from South Africa (52.5%, a difference of 0.30%).
DemographicsRating | RankAssociate's Degree
Immigrants | Belarus
99.9
/100
|
#39
Exceptional
52.8%
Immigrants | Latvia
99.9
/100
|
#40
Exceptional
52.8%
Immigrants | Saudi Arabia
99.9
/100
|
#41
Exceptional
52.6%
Immigrants | Malaysia
99.9
/100
|
#42
Exceptional
52.5%
Immigrants | South Africa
99.9
/100
|
#43
Exceptional
52.5%
Estonians
99.9
/100
|
#44
Exceptional
52.5%
Immigrants | Lithuania
99.9
/100
|
#45
Exceptional
52.4%
Immigrants | Bulgaria
99.9
/100
|
#46
Exceptional
52.4%
Immigrants | Kuwait
99.9
/100
|
#47
Exceptional
52.4%
Immigrants | Norway
99.9
/100
|
#48
Exceptional
52.2%
Immigrants | Austria
99.9
/100
|
#49
Exceptional
52.1%
Asians
99.9
/100
|
#50
Exceptional
52.1%
Immigrants | Greece
99.9
/100
|
#51
Exceptional
52.1%
Bolivians
99.8
/100
|
#52
Exceptional
52.0%
Immigrants | Asia
99.8
/100
|
#53
Exceptional
52.0%