Basque vs Bhutanese Associate's Degree
COMPARE
Basque
Bhutanese
Associate's Degree
Associate's Degree Comparison
Basques
Bhutanese
46.5%
ASSOCIATE'S DEGREE
52.8/ 100
METRIC RATING
171st/ 347
METRIC RANK
51.4%
ASSOCIATE'S DEGREE
99.7/ 100
METRIC RATING
62nd/ 347
METRIC RANK
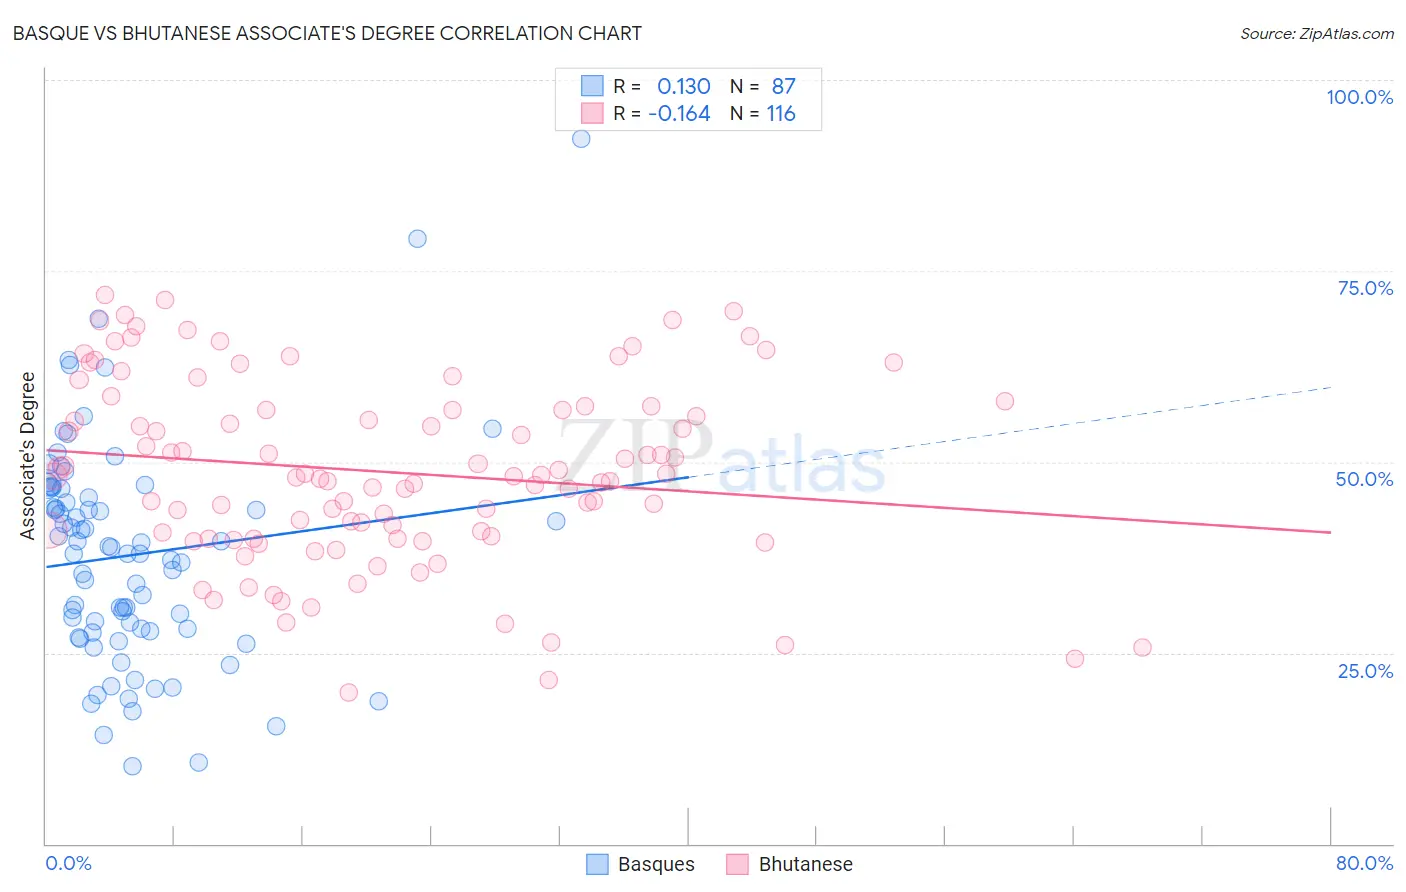
Basque vs Bhutanese Associate's Degree Correlation Chart
The statistical analysis conducted on geographies consisting of 165,778,580 people shows a poor positive correlation between the proportion of Basques and percentage of population with at least associate's degree education in the United States with a correlation coefficient (R) of 0.130 and weighted average of 46.5%. Similarly, the statistical analysis conducted on geographies consisting of 455,542,651 people shows a poor negative correlation between the proportion of Bhutanese and percentage of population with at least associate's degree education in the United States with a correlation coefficient (R) of -0.164 and weighted average of 51.4%, a difference of 10.7%.
Associate's Degree Correlation Summary
| Measurement | Basque | Bhutanese |
| Minimum | 10.2% | 19.7% |
| Maximum | 92.3% | 71.8% |
| Range | 82.1% | 52.1% |
| Mean | 37.8% | 48.7% |
| Median | 38.0% | 48.1% |
| Interquartile 25% (IQ1) | 27.9% | 40.1% |
| Interquartile 75% (IQ3) | 46.5% | 57.0% |
| Interquartile Range (IQR) | 18.6% | 16.9% |
| Standard Deviation (Sample) | 14.5% | 12.0% |
| Standard Deviation (Population) | 14.4% | 12.0% |
Similar Demographics by Associate's Degree
Demographics Similar to Basques by Associate's Degree
In terms of associate's degree, the demographic groups most similar to Basques are Irish (46.5%, a difference of 0.060%), Peruvian (46.4%, a difference of 0.18%), Uruguayan (46.5%, a difference of 0.19%), Immigrants from Iraq (46.4%, a difference of 0.19%), and Immigrants from Somalia (46.5%, a difference of 0.20%).
| Demographics | Rating | Rank | Associate's Degree |
| Colombians | 62.4 /100 | #164 | Good 46.8% |
| Immigrants | South America | 59.9 /100 | #165 | Average 46.7% |
| Hungarians | 59.3 /100 | #166 | Average 46.7% |
| Immigrants | Sierra Leone | 59.2 /100 | #167 | Average 46.7% |
| Immigrants | Somalia | 55.5 /100 | #168 | Average 46.5% |
| Uruguayans | 55.4 /100 | #169 | Average 46.5% |
| Irish | 53.6 /100 | #170 | Average 46.5% |
| Basques | 52.8 /100 | #171 | Average 46.5% |
| Peruvians | 50.5 /100 | #172 | Average 46.4% |
| Immigrants | Iraq | 50.3 /100 | #173 | Average 46.4% |
| English | 50.0 /100 | #174 | Average 46.4% |
| Belgians | 48.9 /100 | #175 | Average 46.3% |
| Finns | 48.5 /100 | #176 | Average 46.3% |
| Slovaks | 48.4 /100 | #177 | Average 46.3% |
| Immigrants | Bosnia and Herzegovina | 48.3 /100 | #178 | Average 46.3% |
Demographics Similar to Bhutanese by Associate's Degree
In terms of associate's degree, the demographic groups most similar to Bhutanese are Immigrants from Kazakhstan (51.4%, a difference of 0.0%), South African (51.4%, a difference of 0.050%), Immigrants from Netherlands (51.4%, a difference of 0.13%), Immigrants from Bolivia (51.5%, a difference of 0.15%), and Zimbabwean (51.3%, a difference of 0.16%).
| Demographics | Rating | Rank | Associate's Degree |
| Australians | 99.8 /100 | #55 | Exceptional 51.9% |
| Immigrants | Czechoslovakia | 99.8 /100 | #56 | Exceptional 51.9% |
| Paraguayans | 99.8 /100 | #57 | Exceptional 51.8% |
| New Zealanders | 99.8 /100 | #58 | Exceptional 51.8% |
| Immigrants | Serbia | 99.8 /100 | #59 | Exceptional 51.7% |
| Immigrants | Bolivia | 99.7 /100 | #60 | Exceptional 51.5% |
| Immigrants | Kazakhstan | 99.7 /100 | #61 | Exceptional 51.4% |
| Bhutanese | 99.7 /100 | #62 | Exceptional 51.4% |
| South Africans | 99.7 /100 | #63 | Exceptional 51.4% |
| Immigrants | Netherlands | 99.7 /100 | #64 | Exceptional 51.4% |
| Zimbabweans | 99.7 /100 | #65 | Exceptional 51.3% |
| Immigrants | Europe | 99.7 /100 | #66 | Exceptional 51.3% |
| Argentineans | 99.6 /100 | #67 | Exceptional 51.2% |
| Immigrants | Indonesia | 99.5 /100 | #68 | Exceptional 51.0% |
| Egyptians | 99.5 /100 | #69 | Exceptional 50.9% |