Cuban vs Immigrants from Southern Europe Associate's Degree

COMPARE

Cuban
Race
Ancestry
AfghanAfricanAlaska NativeAlaskan AthabascanAlbanianAleutAlsatianAmericanApacheArabArapahoArgentineanArmenianAssyrian/Chaldean/SyriacAustralianAustrianBahamianBangladeshiBarbadianBasqueBelgianBelizeanBermudanBhutaneseBlackfeetBolivianBrazilianBritishBritish West IndianBulgarianBurmeseCajunCambodianCanadianCape VerdeanCarpatho RusynCelticCentral AmericanCentral American IndianCherokeeCheyenneChickasawChileanChineseChippewaChoctawColombianColvilleComancheCosta RicanCreeCreekCroatianCrowCubanCypriotCzechCzechoslovakianDanishDelawareDominicanDutchDutch West IndianEastern EuropeanEcuadorianEgyptianEnglishEstonianEthiopianEuropeanFijianFilipinoFinnishFrenchFrench American IndianFrench CanadianGermanGerman RussianGhanaianGreekGuamanian/ChamorroGuatemalanGuyaneseHaitianHmongHonduranHopiHoumaHungarianIcelanderIndian (Asian)IndonesianInupiatIranianIraqiIrishIroquoisIsraeliItalianJamaicanJapaneseJordanianKenyanKiowaKoreanLaotianLatvianLebaneseLiberianLithuanianLumbeeLuxembourgerMacedonianMalaysianMalteseMarshalleseMenomineeMexicanMexican American IndianMongolianMoroccanNative HawaiianNavajoNepaleseNew ZealanderNicaraguanNigerianNorthern EuropeanNorwegianOkinawanOsageOttawaPaiutePakistaniPalestinianPanamanianParaguayanPennsylvania GermanPeruvianPimaPolishPortuguesePotawatomiPuebloPuerto RicanPuget Sound SalishRomanianRussianSalvadoranSamoanScandinavianScotch-IrishScottishSeminoleSenegaleseSerbianShoshoneSierra LeoneanSiouxSlavicSlovakSloveneSomaliSouth AfricanSouth AmericanSouth American IndianSoviet UnionSpaniardSpanishSpanish AmericanSpanish American IndianSri LankanSubsaharan AfricanSudaneseSwedishSwissSyrianTaiwaneseThaiTlingit-HaidaTohono O'OdhamTonganTrinidadian and TobagonianTsimshianTurkishU.S. Virgin IslanderUgandanUkrainianUruguayanUteVenezuelanVietnameseWelshWest IndianYakamaYaquiYugoslavianYumanYup'ikZimbabwean
Immigration
NonimmigrantsImmigrantsAfghanistanAfricaAlbaniaArgentinaArmeniaAsiaAustraliaAustriaBahamasBangladeshBarbadosBelarusBelgiumBelizeBoliviaBosnia and HerzegovinaBrazilBulgariaBurma/MyanmarCabo VerdeCambodiaCameroonCanadaCaribbeanCentral AmericaChileChinaColombiaCongoCosta RicaCroatiaCubaCzechoslovakiaDenmarkDominicaDominican RepublicEastern AfricaEastern AsiaEastern EuropeEcuadorEgyptEl SalvadorEnglandEritreaEthiopiaEuropeFijiFranceGermanyGhanaGreeceGrenadaGuatemalaGuyanaHaitiHondurasHong KongHungaryIndiaIndonesiaIranIraqIrelandIsraelItalyJamaicaJapanJordanKazakhstanKenyaKoreaKuwaitLaosLatin AmericaLatviaLebanonLiberiaLithuaniaMalaysiaMexicoMicronesiaMiddle AfricaMoldovaMoroccoNepalNetherlandsNicaraguaNigeriaNorth AmericaNorth MacedoniaNorthern AfricaNorthern EuropeNorwayOceaniaPakistanPanamaPeruPhilippinesPolandPortugalRomaniaRussiaSaudi ArabiaScotlandSenegalSerbiaSierra LeoneSingaporeSomaliaSouth AfricaSouth AmericaSouth Central AsiaSouth Eastern AsiaSpainSri LankaSt. Vincent and the GrenadinesSudanSwedenSwitzerlandSyriaTaiwanThailandTrinidad and TobagoTurkeyUgandaUkraineUruguayUzbekistanVenezuelaVietnamWest IndiesWestern AfricaWestern AsiaWestern EuropeYemenZaireZimbabweAzores
Immigrants from Southern Europe
Race
Ancestry
AfghanAfricanAlaska NativeAlaskan AthabascanAlbanianAleutAlsatianAmericanApacheArabArapahoArgentineanArmenianAssyrian/Chaldean/SyriacAustralianAustrianBahamianBangladeshiBarbadianBasqueBelgianBelizeanBermudanBhutaneseBlackfeetBolivianBrazilianBritishBritish West IndianBulgarianBurmeseCajunCambodianCanadianCape VerdeanCarpatho RusynCelticCentral AmericanCentral American IndianCherokeeCheyenneChickasawChileanChineseChippewaChoctawColombianColvilleComancheCosta RicanCreeCreekCroatianCrowCypriotCzechCzechoslovakianDanishDelawareDominicanDutchDutch West IndianEastern EuropeanEcuadorianEgyptianEnglishEstonianEthiopianEuropeanFijianFilipinoFinnishFrenchFrench American IndianFrench CanadianGermanGerman RussianGhanaianGreekGuamanian/ChamorroGuatemalanGuyaneseHaitianHmongHonduranHopiHoumaHungarianIcelanderIndian (Asian)IndonesianInupiatIranianIraqiIrishIroquoisIsraeliItalianJamaicanJapaneseJordanianKenyanKiowaKoreanLaotianLatvianLebaneseLiberianLithuanianLumbeeLuxembourgerMacedonianMalaysianMalteseMarshalleseMenomineeMexicanMexican American IndianMongolianMoroccanNative HawaiianNavajoNepaleseNew ZealanderNicaraguanNigerianNorthern EuropeanNorwegianOkinawanOsageOttawaPaiutePakistaniPalestinianPanamanianParaguayanPennsylvania GermanPeruvianPimaPolishPortuguesePotawatomiPuebloPuerto RicanPuget Sound SalishRomanianRussianSalvadoranSamoanScandinavianScotch-IrishScottishSeminoleSenegaleseSerbianShoshoneSierra LeoneanSiouxSlavicSlovakSloveneSomaliSouth AfricanSouth AmericanSouth American IndianSoviet UnionSpaniardSpanishSpanish AmericanSpanish American IndianSri LankanSubsaharan AfricanSudaneseSwedishSwissSyrianTaiwaneseThaiTlingit-HaidaTohono O'OdhamTonganTrinidadian and TobagonianTsimshianTurkishU.S. Virgin IslanderUgandanUkrainianUruguayanUteVenezuelanVietnameseWelshWest IndianYakamaYaquiYugoslavianYumanYup'ikZimbabwean
Immigration
NonimmigrantsImmigrantsAfghanistanAfricaAlbaniaArgentinaArmeniaAsiaAustraliaAustriaBahamasBangladeshBarbadosBelarusBelgiumBelizeBoliviaBosnia and HerzegovinaBrazilBulgariaBurma/MyanmarCabo VerdeCambodiaCameroonCanadaCaribbeanCentral AmericaChileChinaColombiaCongoCosta RicaCroatiaCubaCzechoslovakiaDenmarkDominicaDominican RepublicEastern AfricaEastern AsiaEastern EuropeEcuadorEgyptEl SalvadorEnglandEritreaEthiopiaEuropeFijiFranceGermanyGhanaGreeceGrenadaGuatemalaGuyanaHaitiHondurasHong KongHungaryIndiaIndonesiaIranIraqIrelandIsraelItalyJamaicaJapanJordanKazakhstanKenyaKoreaKuwaitLaosLatin AmericaLatviaLebanonLiberiaLithuaniaMalaysiaMexicoMicronesiaMiddle AfricaMoldovaMoroccoNepalNetherlandsNicaraguaNigeriaNorth AmericaNorth MacedoniaNorthern AfricaNorthern EuropeNorwayOceaniaPakistanPanamaPeruPhilippinesPolandPortugalRomaniaRussiaSaudi ArabiaScotlandSenegalSerbiaSierra LeoneSingaporeSomaliaSouth AfricaSouth AmericaSouth Central AsiaSouth Eastern AsiaSouthern EuropeSpainSri LankaSt. Vincent and the GrenadinesSudanSwedenSwitzerlandSyriaTaiwanThailandTrinidad and TobagoTurkeyUgandaUkraineUruguayUzbekistanVenezuelaVietnamWest IndiesWestern AfricaWestern AsiaWestern EuropeYemenZaireZimbabweAzores
Associate's Degree
Income
Poverty
Unemployment
Labor Participation
Family Structure
Vehicle Availability
Education Level
Disability

Associate's Degree Comparison

Cubans

Immigrants from Southern Europe

Tragic
Excellent
41.9%
ASSOCIATE'S DEGREE
0.6/ 100
METRIC RATING
254th/ 347
METRIC RANK
47.8%
ASSOCIATE'S DEGREE
84.4/ 100
METRIC RATING
140th/ 347
METRIC RANK

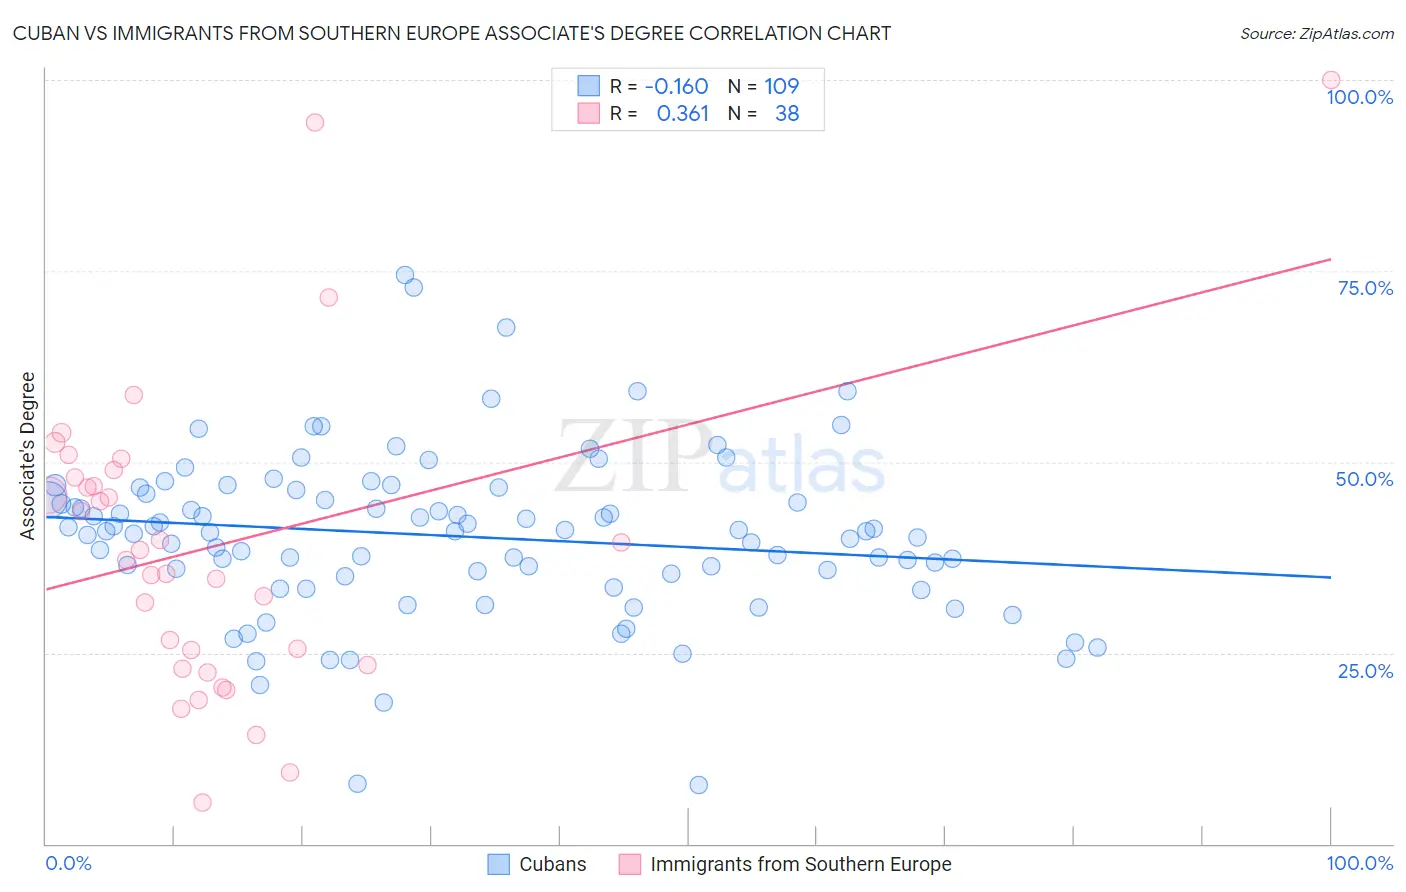
Cuban vs Immigrants from Southern Europe Associate's Degree Correlation Chart

The statistical analysis conducted on geographies consisting of 449,326,407 people shows a poor negative correlation between the proportion of Cubans and percentage of population with at least associate's degree education in the United States with a correlation coefficient (R) of -0.160 and weighted average of 41.9%. Similarly, the statistical analysis conducted on geographies consisting of 402,795,863 people shows a mild positive correlation between the proportion of Immigrants from Southern Europe and percentage of population with at least associate's degree education in the United States with a correlation coefficient (R) of 0.361 and weighted average of 47.8%, a difference of 14.2%.
Cuban vs Immigrants from Southern Europe Associate's Degree

Associate's Degree Correlation Summary

MeasurementCubanImmigrants from Southern Europe
Minimum7.8%5.4%
Maximum74.4%100.0%
Range66.7%94.6%
Mean40.3%38.9%
Median41.0%37.8%
Interquartile 25% (IQ1)35.1%23.3%
Interquartile 75% (IQ3)46.0%48.0%
Interquartile Range (IQR)10.9%24.7%
Standard Deviation (Sample)10.9%20.1%
Standard Deviation (Population)10.8%19.9%

Similar Demographics by Associate's Degree

Demographics Similar to Cubans by Associate's Degree

In terms of associate's degree, the demographic groups most similar to Cubans are Indonesian (41.9%, a difference of 0.060%), Immigrants from Guyana (41.8%, a difference of 0.090%), French American Indian (42.0%, a difference of 0.17%), Immigrants from Congo (41.8%, a difference of 0.21%), and Spanish American (41.8%, a difference of 0.27%).
DemographicsRating | RankAssociate's Degree
Immigrants | Fiji
0.8
/100
|
#247
Tragic
42.2%
Immigrants | Ecuador
0.8
/100
|
#248
Tragic
42.2%
Jamaicans
0.7
/100
|
#249
Tragic
42.1%
U.S. Virgin Islanders
0.7
/100
|
#250
Tragic
42.1%
Immigrants | Bahamas
0.7
/100
|
#251
Tragic
42.1%
French American Indians
0.6
/100
|
#252
Tragic
42.0%
Indonesians
0.6
/100
|
#253
Tragic
41.9%
Cubans
0.6
/100
|
#254
Tragic
41.9%
Immigrants | Guyana
0.5
/100
|
#255
Tragic
41.8%
Immigrants | Congo
0.5
/100
|
#256
Tragic
41.8%
Spanish Americans
0.5
/100
|
#257
Tragic
41.8%
Japanese
0.5
/100
|
#258
Tragic
41.7%
Malaysians
0.4
/100
|
#259
Tragic
41.6%
Marshallese
0.4
/100
|
#260
Tragic
41.6%
Nicaraguans
0.4
/100
|
#261
Tragic
41.5%

Demographics Similar to Immigrants from Southern Europe by Associate's Degree

In terms of associate's degree, the demographic groups most similar to Immigrants from Southern Europe are Slovene (47.9%, a difference of 0.090%), Taiwanese (47.7%, a difference of 0.15%), Sierra Leonean (47.7%, a difference of 0.20%), Norwegian (47.6%, a difference of 0.43%), and Polish (48.0%, a difference of 0.44%).
DemographicsRating | RankAssociate's Degree
Assyrians/Chaldeans/Syriacs
89.4
/100
|
#133
Excellent
48.2%
Moroccans
89.3
/100
|
#134
Excellent
48.2%
Europeans
89.0
/100
|
#135
Excellent
48.2%
Pakistanis
88.0
/100
|
#136
Excellent
48.1%
Immigrants | Eritrea
87.8
/100
|
#137
Excellent
48.1%
Poles
87.3
/100
|
#138
Excellent
48.0%
Slovenes
85.1
/100
|
#139
Excellent
47.9%
Immigrants | Southern Europe
84.4
/100
|
#140
Excellent
47.8%
Taiwanese
83.3
/100
|
#141
Excellent
47.7%
Sierra Leoneans
82.9
/100
|
#142
Excellent
47.7%
Norwegians
81.0
/100
|
#143
Excellent
47.6%
Slavs
80.5
/100
|
#144
Excellent
47.6%
Canadians
79.0
/100
|
#145
Good
47.5%
Immigrants | Sudan
77.9
/100
|
#146
Good
47.4%
Danes
77.3
/100
|
#147
Good
47.4%