Argentinean vs Immigrants from North Macedonia Professional Degree
COMPARE
Argentinean
Immigrants from North Macedonia
Professional Degree
Professional Degree Comparison
Argentineans
Immigrants from North Macedonia
5.9%
PROFESSIONAL DEGREE
100.0/ 100
METRIC RATING
44th/ 347
METRIC RANK
4.2%
PROFESSIONAL DEGREE
20.2/ 100
METRIC RATING
200th/ 347
METRIC RANK
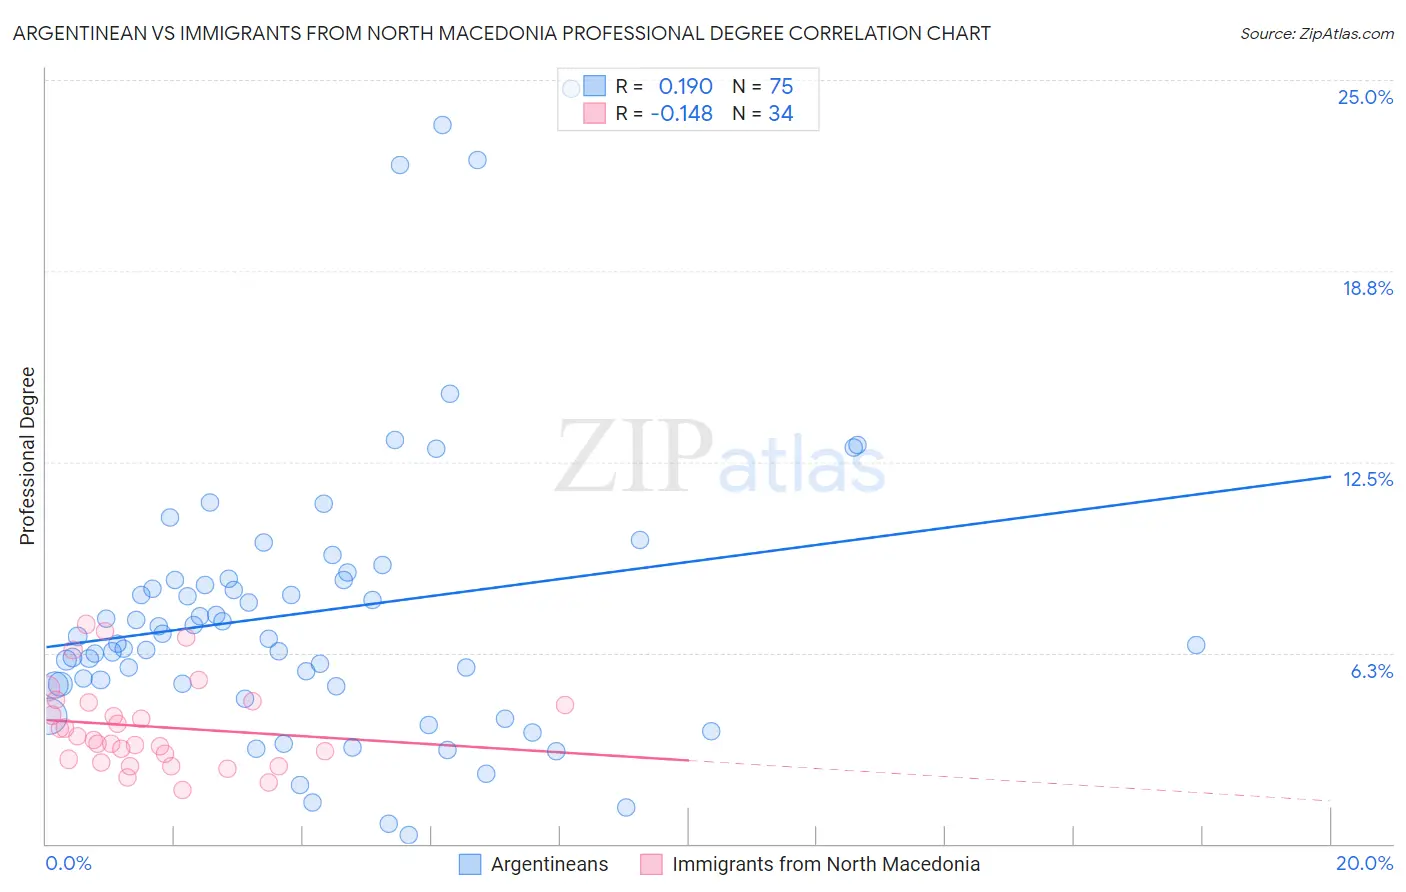
Argentinean vs Immigrants from North Macedonia Professional Degree Correlation Chart
The statistical analysis conducted on geographies consisting of 296,877,739 people shows a poor positive correlation between the proportion of Argentineans and percentage of population with at least professional degree education in the United States with a correlation coefficient (R) of 0.190 and weighted average of 5.9%. Similarly, the statistical analysis conducted on geographies consisting of 74,021,908 people shows a poor negative correlation between the proportion of Immigrants from North Macedonia and percentage of population with at least professional degree education in the United States with a correlation coefficient (R) of -0.148 and weighted average of 4.2%, a difference of 41.5%.
Professional Degree Correlation Summary
| Measurement | Argentinean | Immigrants from North Macedonia |
| Minimum | 0.30% | 1.8% |
| Maximum | 24.7% | 7.2% |
| Range | 24.4% | 5.4% |
| Mean | 7.6% | 3.8% |
| Median | 6.7% | 3.5% |
| Interquartile 25% (IQ1) | 5.2% | 2.8% |
| Interquartile 75% (IQ3) | 8.7% | 4.6% |
| Interquartile Range (IQR) | 3.5% | 1.8% |
| Standard Deviation (Sample) | 4.8% | 1.4% |
| Standard Deviation (Population) | 4.8% | 1.4% |
Similar Demographics by Professional Degree
Demographics Similar to Argentineans by Professional Degree
In terms of professional degree, the demographic groups most similar to Argentineans are Immigrants from Saudi Arabia (5.9%, a difference of 0.16%), Immigrants from South Central Asia (5.9%, a difference of 0.45%), Estonian (6.0%, a difference of 0.48%), New Zealander (6.0%, a difference of 0.49%), and Immigrants from Argentina (5.9%, a difference of 0.65%).
| Demographics | Rating | Rank | Professional Degree |
| Immigrants | Austria | 100.0 /100 | #37 | Exceptional 6.0% |
| Immigrants | Norway | 100.0 /100 | #38 | Exceptional 6.0% |
| Immigrants | South Africa | 100.0 /100 | #39 | Exceptional 6.0% |
| Cambodians | 100.0 /100 | #40 | Exceptional 6.0% |
| New Zealanders | 100.0 /100 | #41 | Exceptional 6.0% |
| Estonians | 100.0 /100 | #42 | Exceptional 6.0% |
| Immigrants | Saudi Arabia | 100.0 /100 | #43 | Exceptional 5.9% |
| Argentineans | 100.0 /100 | #44 | Exceptional 5.9% |
| Immigrants | South Central Asia | 100.0 /100 | #45 | Exceptional 5.9% |
| Immigrants | Argentina | 100.0 /100 | #46 | Exceptional 5.9% |
| Australians | 100.0 /100 | #47 | Exceptional 5.9% |
| Paraguayans | 100.0 /100 | #48 | Exceptional 5.9% |
| Immigrants | Latvia | 100.0 /100 | #49 | Exceptional 5.8% |
| Immigrants | Czechoslovakia | 100.0 /100 | #50 | Exceptional 5.8% |
| Immigrants | Greece | 100.0 /100 | #51 | Exceptional 5.8% |
Demographics Similar to Immigrants from North Macedonia by Professional Degree
In terms of professional degree, the demographic groups most similar to Immigrants from North Macedonia are Norwegian (4.2%, a difference of 0.080%), Finnish (4.2%, a difference of 0.36%), Immigrants from Middle Africa (4.2%, a difference of 0.44%), Czechoslovakian (4.2%, a difference of 0.50%), and Spanish (4.2%, a difference of 0.64%).
| Demographics | Rating | Rank | Professional Degree |
| French | 27.1 /100 | #193 | Fair 4.2% |
| Scandinavians | 25.8 /100 | #194 | Fair 4.2% |
| Nigerians | 24.6 /100 | #195 | Fair 4.2% |
| Spanish | 23.0 /100 | #196 | Fair 4.2% |
| Czechoslovakians | 22.4 /100 | #197 | Fair 4.2% |
| Immigrants | Middle Africa | 22.1 /100 | #198 | Fair 4.2% |
| Norwegians | 20.5 /100 | #199 | Fair 4.2% |
| Immigrants | North Macedonia | 20.2 /100 | #200 | Fair 4.2% |
| Finns | 18.7 /100 | #201 | Poor 4.2% |
| Immigrants | Iraq | 17.1 /100 | #202 | Poor 4.2% |
| Panamanians | 15.9 /100 | #203 | Poor 4.1% |
| Barbadians | 15.8 /100 | #204 | Poor 4.1% |
| Somalis | 14.8 /100 | #205 | Poor 4.1% |
| Yugoslavians | 13.4 /100 | #206 | Poor 4.1% |
| Sub-Saharan Africans | 12.8 /100 | #207 | Poor 4.1% |