Samoan vs Immigrants from North Macedonia Professional Degree
COMPARE
Samoan
Immigrants from North Macedonia
Professional Degree
Professional Degree Comparison
Samoans
Immigrants from North Macedonia
3.3%
PROFESSIONAL DEGREE
0.1/ 100
METRIC RATING
307th/ 347
METRIC RANK
4.2%
PROFESSIONAL DEGREE
20.2/ 100
METRIC RATING
200th/ 347
METRIC RANK
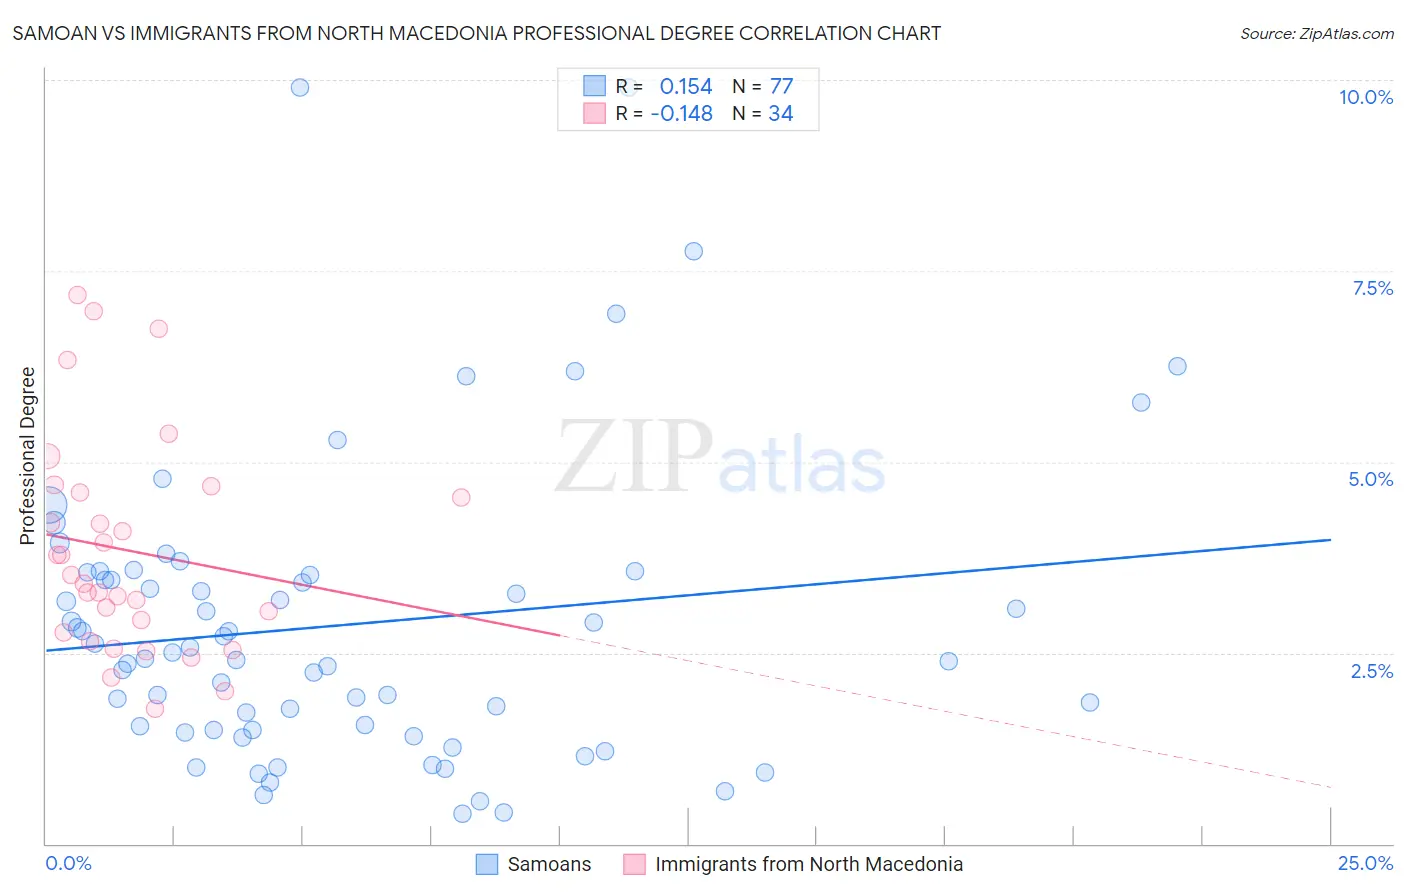
Samoan vs Immigrants from North Macedonia Professional Degree Correlation Chart
The statistical analysis conducted on geographies consisting of 224,756,232 people shows a poor positive correlation between the proportion of Samoans and percentage of population with at least professional degree education in the United States with a correlation coefficient (R) of 0.154 and weighted average of 3.3%. Similarly, the statistical analysis conducted on geographies consisting of 74,021,908 people shows a poor negative correlation between the proportion of Immigrants from North Macedonia and percentage of population with at least professional degree education in the United States with a correlation coefficient (R) of -0.148 and weighted average of 4.2%, a difference of 25.9%.
Professional Degree Correlation Summary
| Measurement | Samoan | Immigrants from North Macedonia |
| Minimum | 0.40% | 1.8% |
| Maximum | 9.9% | 7.2% |
| Range | 9.5% | 5.4% |
| Mean | 2.9% | 3.8% |
| Median | 2.5% | 3.5% |
| Interquartile 25% (IQ1) | 1.5% | 2.8% |
| Interquartile 75% (IQ3) | 3.5% | 4.6% |
| Interquartile Range (IQR) | 2.1% | 1.8% |
| Standard Deviation (Sample) | 1.9% | 1.4% |
| Standard Deviation (Population) | 1.9% | 1.4% |
Similar Demographics by Professional Degree
Demographics Similar to Samoans by Professional Degree
In terms of professional degree, the demographic groups most similar to Samoans are Shoshone (3.3%, a difference of 0.50%), Pima (3.3%, a difference of 0.51%), Immigrants from Latin America (3.3%, a difference of 0.83%), Cherokee (3.3%, a difference of 0.99%), and Cape Verdean (3.4%, a difference of 1.1%).
| Demographics | Rating | Rank | Professional Degree |
| Blacks/African Americans | 0.2 /100 | #300 | Tragic 3.4% |
| Immigrants | Dominican Republic | 0.2 /100 | #301 | Tragic 3.4% |
| Malaysians | 0.2 /100 | #302 | Tragic 3.4% |
| Immigrants | Haiti | 0.2 /100 | #303 | Tragic 3.4% |
| Cajuns | 0.2 /100 | #304 | Tragic 3.4% |
| Chickasaw | 0.1 /100 | #305 | Tragic 3.4% |
| Cape Verdeans | 0.1 /100 | #306 | Tragic 3.4% |
| Samoans | 0.1 /100 | #307 | Tragic 3.3% |
| Shoshone | 0.1 /100 | #308 | Tragic 3.3% |
| Pima | 0.1 /100 | #309 | Tragic 3.3% |
| Immigrants | Latin America | 0.1 /100 | #310 | Tragic 3.3% |
| Cherokee | 0.1 /100 | #311 | Tragic 3.3% |
| Sioux | 0.1 /100 | #312 | Tragic 3.3% |
| Yuman | 0.1 /100 | #313 | Tragic 3.3% |
| Mexican American Indians | 0.1 /100 | #314 | Tragic 3.3% |
Demographics Similar to Immigrants from North Macedonia by Professional Degree
In terms of professional degree, the demographic groups most similar to Immigrants from North Macedonia are Norwegian (4.2%, a difference of 0.080%), Finnish (4.2%, a difference of 0.36%), Immigrants from Middle Africa (4.2%, a difference of 0.44%), Czechoslovakian (4.2%, a difference of 0.50%), and Spanish (4.2%, a difference of 0.64%).
| Demographics | Rating | Rank | Professional Degree |
| French | 27.1 /100 | #193 | Fair 4.2% |
| Scandinavians | 25.8 /100 | #194 | Fair 4.2% |
| Nigerians | 24.6 /100 | #195 | Fair 4.2% |
| Spanish | 23.0 /100 | #196 | Fair 4.2% |
| Czechoslovakians | 22.4 /100 | #197 | Fair 4.2% |
| Immigrants | Middle Africa | 22.1 /100 | #198 | Fair 4.2% |
| Norwegians | 20.5 /100 | #199 | Fair 4.2% |
| Immigrants | North Macedonia | 20.2 /100 | #200 | Fair 4.2% |
| Finns | 18.7 /100 | #201 | Poor 4.2% |
| Immigrants | Iraq | 17.1 /100 | #202 | Poor 4.2% |
| Panamanians | 15.9 /100 | #203 | Poor 4.1% |
| Barbadians | 15.8 /100 | #204 | Poor 4.1% |
| Somalis | 14.8 /100 | #205 | Poor 4.1% |
| Yugoslavians | 13.4 /100 | #206 | Poor 4.1% |
| Sub-Saharan Africans | 12.8 /100 | #207 | Poor 4.1% |