Argentinean vs Immigrants from El Salvador Professional Degree
COMPARE
Argentinean
Immigrants from El Salvador
Professional Degree
Professional Degree Comparison
Argentineans
Immigrants from El Salvador
5.9%
PROFESSIONAL DEGREE
100.0/ 100
METRIC RATING
44th/ 347
METRIC RANK
3.5%
PROFESSIONAL DEGREE
0.3/ 100
METRIC RATING
287th/ 347
METRIC RANK
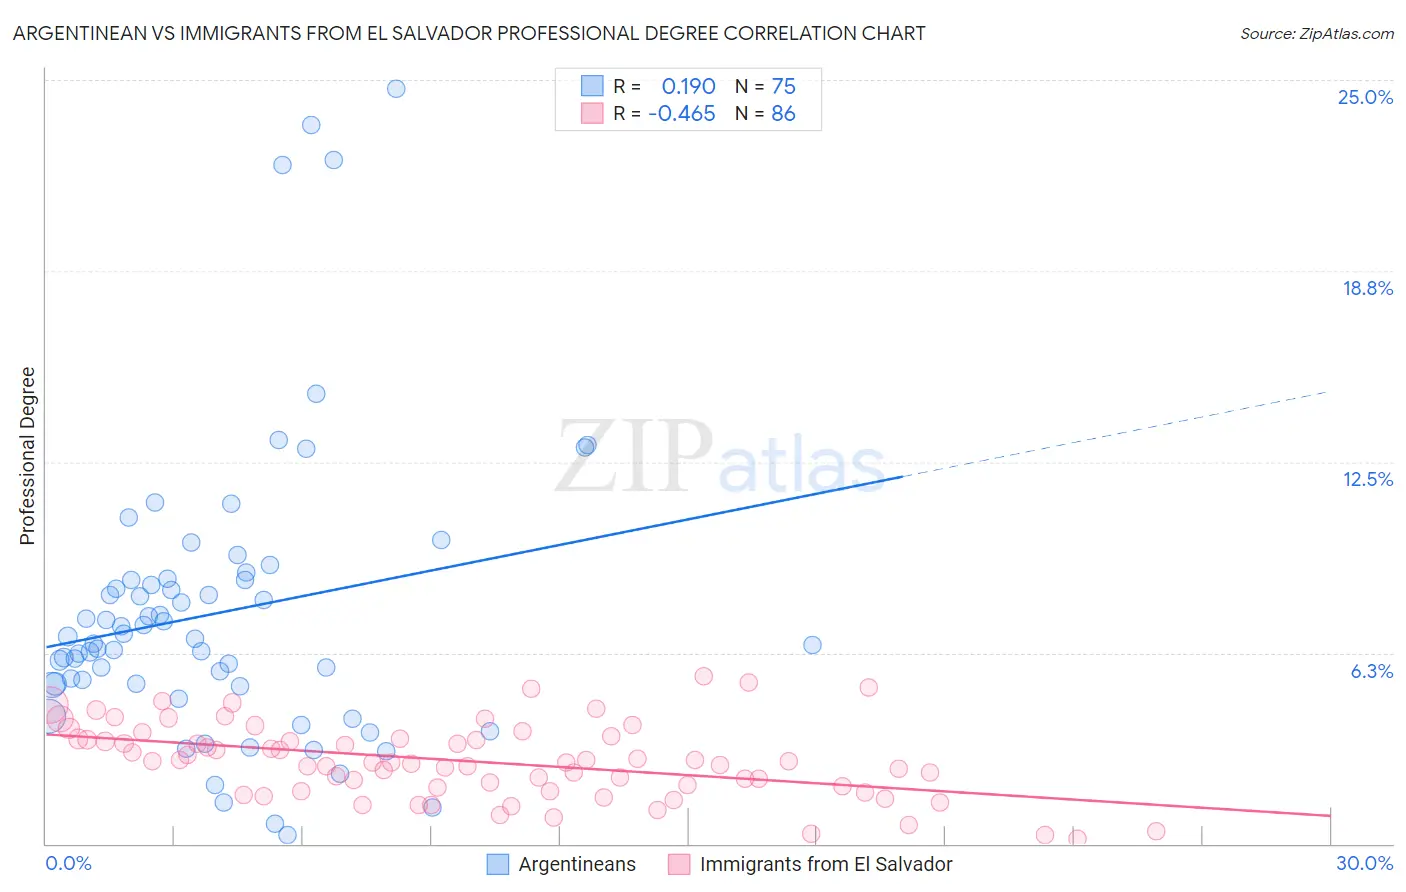
Argentinean vs Immigrants from El Salvador Professional Degree Correlation Chart
The statistical analysis conducted on geographies consisting of 296,877,739 people shows a poor positive correlation between the proportion of Argentineans and percentage of population with at least professional degree education in the United States with a correlation coefficient (R) of 0.190 and weighted average of 5.9%. Similarly, the statistical analysis conducted on geographies consisting of 356,542,562 people shows a moderate negative correlation between the proportion of Immigrants from El Salvador and percentage of population with at least professional degree education in the United States with a correlation coefficient (R) of -0.465 and weighted average of 3.5%, a difference of 70.5%.
Professional Degree Correlation Summary
| Measurement | Argentinean | Immigrants from El Salvador |
| Minimum | 0.30% | 0.14% |
| Maximum | 24.7% | 5.5% |
| Range | 24.4% | 5.3% |
| Mean | 7.6% | 2.7% |
| Median | 6.7% | 2.7% |
| Interquartile 25% (IQ1) | 5.2% | 1.8% |
| Interquartile 75% (IQ3) | 8.7% | 3.4% |
| Interquartile Range (IQR) | 3.5% | 1.6% |
| Standard Deviation (Sample) | 4.8% | 1.2% |
| Standard Deviation (Population) | 4.8% | 1.2% |
Similar Demographics by Professional Degree
Demographics Similar to Argentineans by Professional Degree
In terms of professional degree, the demographic groups most similar to Argentineans are Immigrants from Saudi Arabia (5.9%, a difference of 0.16%), Immigrants from South Central Asia (5.9%, a difference of 0.45%), Estonian (6.0%, a difference of 0.48%), New Zealander (6.0%, a difference of 0.49%), and Immigrants from Argentina (5.9%, a difference of 0.65%).
| Demographics | Rating | Rank | Professional Degree |
| Immigrants | Austria | 100.0 /100 | #37 | Exceptional 6.0% |
| Immigrants | Norway | 100.0 /100 | #38 | Exceptional 6.0% |
| Immigrants | South Africa | 100.0 /100 | #39 | Exceptional 6.0% |
| Cambodians | 100.0 /100 | #40 | Exceptional 6.0% |
| New Zealanders | 100.0 /100 | #41 | Exceptional 6.0% |
| Estonians | 100.0 /100 | #42 | Exceptional 6.0% |
| Immigrants | Saudi Arabia | 100.0 /100 | #43 | Exceptional 5.9% |
| Argentineans | 100.0 /100 | #44 | Exceptional 5.9% |
| Immigrants | South Central Asia | 100.0 /100 | #45 | Exceptional 5.9% |
| Immigrants | Argentina | 100.0 /100 | #46 | Exceptional 5.9% |
| Australians | 100.0 /100 | #47 | Exceptional 5.9% |
| Paraguayans | 100.0 /100 | #48 | Exceptional 5.9% |
| Immigrants | Latvia | 100.0 /100 | #49 | Exceptional 5.8% |
| Immigrants | Czechoslovakia | 100.0 /100 | #50 | Exceptional 5.8% |
| Immigrants | Greece | 100.0 /100 | #51 | Exceptional 5.8% |
Demographics Similar to Immigrants from El Salvador by Professional Degree
In terms of professional degree, the demographic groups most similar to Immigrants from El Salvador are Blackfeet (3.5%, a difference of 0.050%), Haitian (3.5%, a difference of 0.10%), Guatemalan (3.5%, a difference of 0.22%), Chippewa (3.5%, a difference of 0.23%), and Alaska Native (3.5%, a difference of 0.41%).
| Demographics | Rating | Rank | Professional Degree |
| Dominicans | 0.5 /100 | #280 | Tragic 3.5% |
| Apache | 0.5 /100 | #281 | Tragic 3.5% |
| Immigrants | Caribbean | 0.5 /100 | #282 | Tragic 3.5% |
| Comanche | 0.4 /100 | #283 | Tragic 3.5% |
| Salvadorans | 0.4 /100 | #284 | Tragic 3.5% |
| Hondurans | 0.3 /100 | #285 | Tragic 3.5% |
| Haitians | 0.3 /100 | #286 | Tragic 3.5% |
| Immigrants | El Salvador | 0.3 /100 | #287 | Tragic 3.5% |
| Blackfeet | 0.3 /100 | #288 | Tragic 3.5% |
| Guatemalans | 0.3 /100 | #289 | Tragic 3.5% |
| Chippewa | 0.3 /100 | #290 | Tragic 3.5% |
| Alaska Natives | 0.3 /100 | #291 | Tragic 3.5% |
| Immigrants | Belize | 0.3 /100 | #292 | Tragic 3.5% |
| Immigrants | Honduras | 0.3 /100 | #293 | Tragic 3.5% |
| Paiute | 0.3 /100 | #294 | Tragic 3.4% |