Immigrants from Laos vs Immigrants from Haiti 11th Grade
COMPARE
Immigrants from Laos
Immigrants from Haiti
11th Grade
11th Grade Comparison
Immigrants from Laos
Immigrants from Haiti
90.5%
11TH GRADE
0.0/ 100
METRIC RATING
284th/ 347
METRIC RANK
89.9%
11TH GRADE
0.0/ 100
METRIC RATING
300th/ 347
METRIC RANK
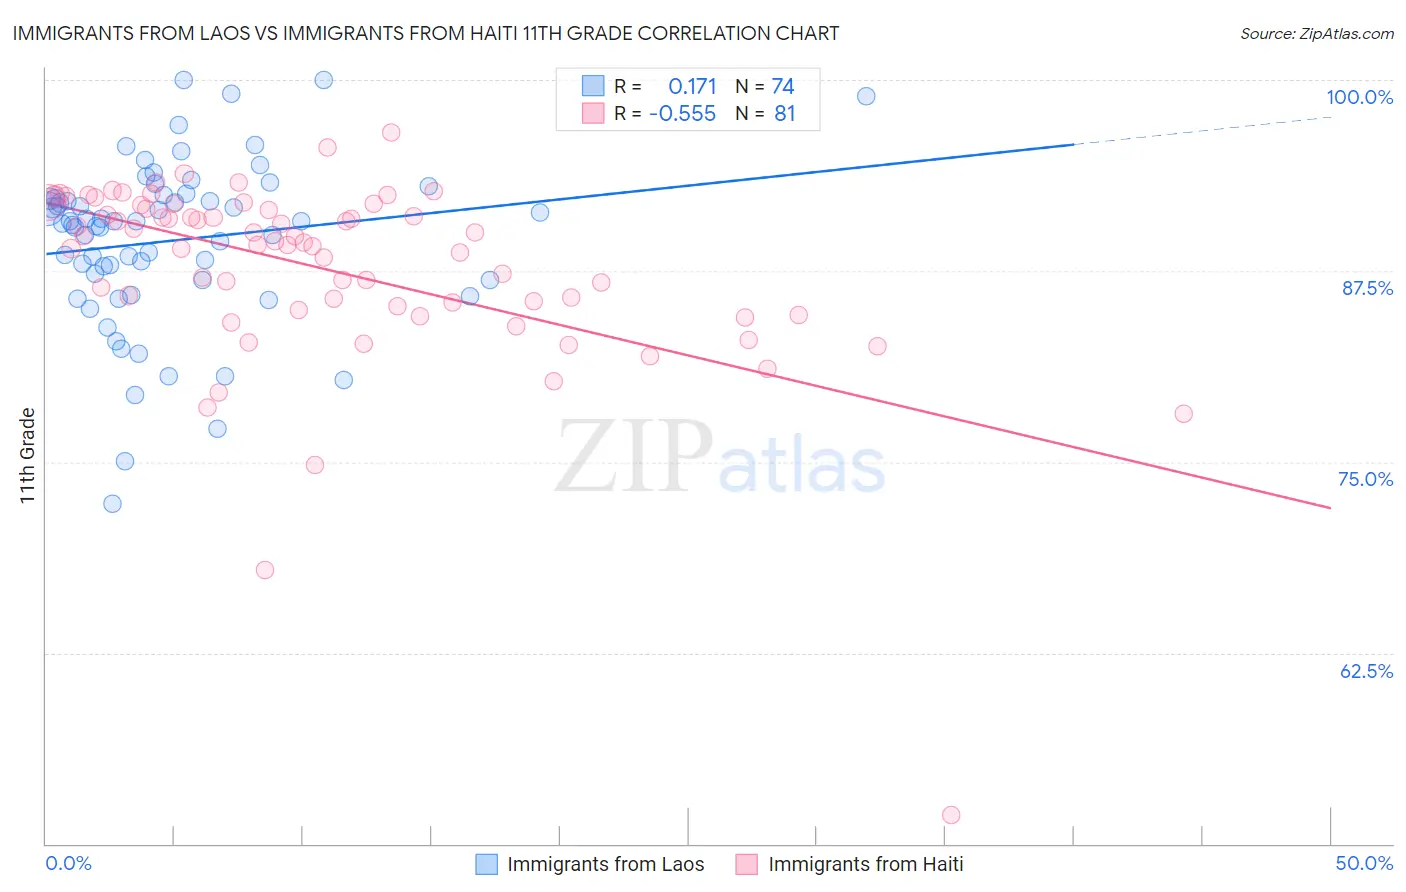
Immigrants from Laos vs Immigrants from Haiti 11th Grade Correlation Chart
The statistical analysis conducted on geographies consisting of 201,472,886 people shows a poor positive correlation between the proportion of Immigrants from Laos and percentage of population with at least 11th grade education in the United States with a correlation coefficient (R) of 0.171 and weighted average of 90.5%. Similarly, the statistical analysis conducted on geographies consisting of 225,286,322 people shows a substantial negative correlation between the proportion of Immigrants from Haiti and percentage of population with at least 11th grade education in the United States with a correlation coefficient (R) of -0.555 and weighted average of 89.9%, a difference of 0.67%.
11th Grade Correlation Summary
| Measurement | Immigrants from Laos | Immigrants from Haiti |
| Minimum | 72.3% | 51.9% |
| Maximum | 100.0% | 96.6% |
| Range | 27.7% | 44.7% |
| Mean | 89.5% | 87.6% |
| Median | 90.7% | 89.3% |
| Interquartile 25% (IQ1) | 86.9% | 85.1% |
| Interquartile 75% (IQ3) | 92.3% | 91.7% |
| Interquartile Range (IQR) | 5.3% | 6.6% |
| Standard Deviation (Sample) | 5.4% | 6.3% |
| Standard Deviation (Population) | 5.4% | 6.3% |
Demographics Similar to Immigrants from Laos and Immigrants from Haiti by 11th Grade
In terms of 11th grade, the demographic groups most similar to Immigrants from Laos are Immigrants from Burma/Myanmar (90.4%, a difference of 0.090%), Immigrants from West Indies (90.4%, a difference of 0.14%), Apache (90.4%, a difference of 0.15%), Immigrants from Barbados (90.7%, a difference of 0.17%), and Pennsylvania German (90.3%, a difference of 0.17%). Similarly, the demographic groups most similar to Immigrants from Haiti are Japanese (89.9%, a difference of 0.010%), Guyanese (89.9%, a difference of 0.010%), Immigrants from Fiji (89.9%, a difference of 0.040%), Navajo (90.0%, a difference of 0.11%), and Fijian (90.0%, a difference of 0.15%).
| Demographics | Rating | Rank | 11th Grade |
| Immigrants | St. Vincent and the Grenadines | 0.0 /100 | #282 | Tragic 90.7% |
| Immigrants | Barbados | 0.0 /100 | #283 | Tragic 90.7% |
| Immigrants | Laos | 0.0 /100 | #284 | Tragic 90.5% |
| Immigrants | Burma/Myanmar | 0.0 /100 | #285 | Tragic 90.4% |
| Immigrants | West Indies | 0.0 /100 | #286 | Tragic 90.4% |
| Apache | 0.0 /100 | #287 | Tragic 90.4% |
| Pennsylvania Germans | 0.0 /100 | #288 | Tragic 90.3% |
| British West Indians | 0.0 /100 | #289 | Tragic 90.3% |
| Indonesians | 0.0 /100 | #290 | Tragic 90.3% |
| Haitians | 0.0 /100 | #291 | Tragic 90.3% |
| Cubans | 0.0 /100 | #292 | Tragic 90.2% |
| Natives/Alaskans | 0.0 /100 | #293 | Tragic 90.2% |
| Immigrants | Grenada | 0.0 /100 | #294 | Tragic 90.1% |
| Immigrants | Vietnam | 0.0 /100 | #295 | Tragic 90.0% |
| Fijians | 0.0 /100 | #296 | Tragic 90.0% |
| Navajo | 0.0 /100 | #297 | Tragic 90.0% |
| Immigrants | Fiji | 0.0 /100 | #298 | Tragic 89.9% |
| Japanese | 0.0 /100 | #299 | Tragic 89.9% |
| Immigrants | Haiti | 0.0 /100 | #300 | Tragic 89.9% |
| Guyanese | 0.0 /100 | #301 | Tragic 89.9% |
| Immigrants | Guyana | 0.0 /100 | #302 | Tragic 89.7% |