Yup'ik vs Immigrants from India Female Disability
COMPARE
Yup'ik
Immigrants from India
Female Disability
Female Disability Comparison
Yup'ik
Immigrants from India
11.6%
FEMALE DISABILITY
99.5/ 100
METRIC RATING
88th/ 347
METRIC RANK
10.0%
FEMALE DISABILITY
100.0/ 100
METRIC RATING
1st/ 347
METRIC RANK
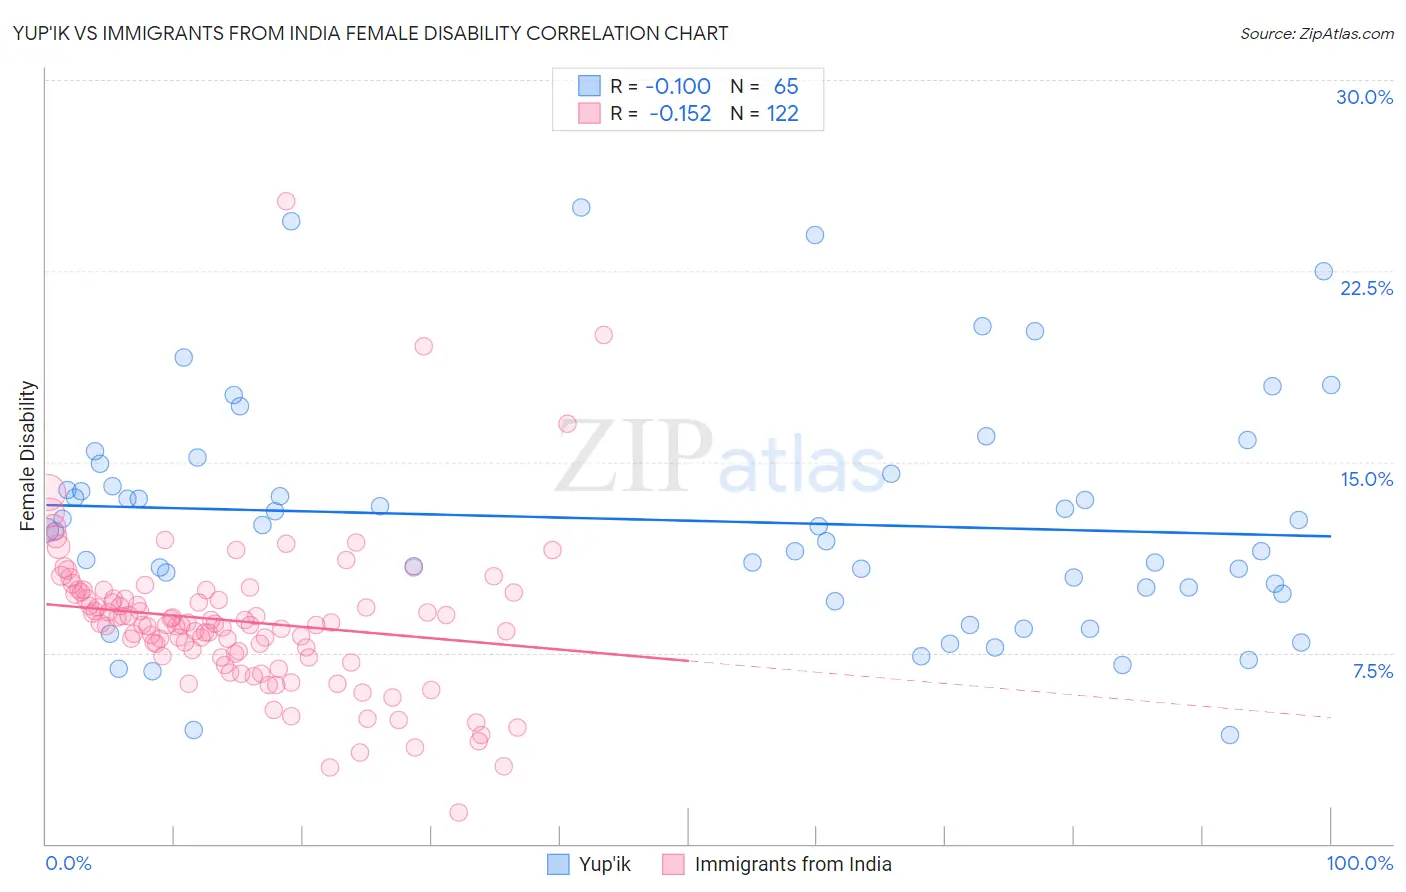
Yup'ik vs Immigrants from India Female Disability Correlation Chart
The statistical analysis conducted on geographies consisting of 39,957,133 people shows a slight negative correlation between the proportion of Yup'ik and percentage of females with a disability in the United States with a correlation coefficient (R) of -0.100 and weighted average of 11.6%. Similarly, the statistical analysis conducted on geographies consisting of 434,078,720 people shows a poor negative correlation between the proportion of Immigrants from India and percentage of females with a disability in the United States with a correlation coefficient (R) of -0.152 and weighted average of 10.0%, a difference of 16.1%.
Female Disability Correlation Summary
| Measurement | Yup'ik | Immigrants from India |
| Minimum | 4.3% | 1.2% |
| Maximum | 25.0% | 25.3% |
| Range | 20.7% | 24.0% |
| Mean | 12.7% | 8.7% |
| Median | 12.3% | 8.6% |
| Interquartile 25% (IQ1) | 9.9% | 7.4% |
| Interquartile 75% (IQ3) | 14.7% | 9.8% |
| Interquartile Range (IQR) | 4.8% | 2.5% |
| Standard Deviation (Sample) | 4.6% | 3.1% |
| Standard Deviation (Population) | 4.5% | 3.1% |
Similar Demographics by Female Disability
Demographics Similar to Yup'ik by Female Disability
In terms of female disability, the demographic groups most similar to Yup'ik are Immigrants from Denmark (11.6%, a difference of 0.0%), Palestinian (11.6%, a difference of 0.070%), Immigrants from Cameroon (11.6%, a difference of 0.070%), Immigrants from Poland (11.6%, a difference of 0.10%), and Vietnamese (11.6%, a difference of 0.10%).
| Demographics | Rating | Rank | Female Disability |
| Eastern Europeans | 99.7 /100 | #81 | Exceptional 11.5% |
| Luxembourgers | 99.6 /100 | #82 | Exceptional 11.6% |
| Immigrants | Serbia | 99.6 /100 | #83 | Exceptional 11.6% |
| Immigrants | Poland | 99.6 /100 | #84 | Exceptional 11.6% |
| Palestinians | 99.6 /100 | #85 | Exceptional 11.6% |
| Immigrants | Cameroon | 99.6 /100 | #86 | Exceptional 11.6% |
| Immigrants | Denmark | 99.5 /100 | #87 | Exceptional 11.6% |
| Yup'ik | 99.5 /100 | #88 | Exceptional 11.6% |
| Vietnamese | 99.5 /100 | #89 | Exceptional 11.6% |
| Immigrants | Romania | 99.5 /100 | #90 | Exceptional 11.6% |
| Immigrants | Zimbabwe | 99.5 /100 | #91 | Exceptional 11.6% |
| Immigrants | Czechoslovakia | 99.5 /100 | #92 | Exceptional 11.6% |
| Immigrants | Sierra Leone | 99.4 /100 | #93 | Exceptional 11.6% |
| Immigrants | Brazil | 99.4 /100 | #94 | Exceptional 11.6% |
| Immigrants | Northern Europe | 99.4 /100 | #95 | Exceptional 11.6% |
Demographics Similar to Immigrants from India by Female Disability
In terms of female disability, the demographic groups most similar to Immigrants from India are Filipino (10.1%, a difference of 0.93%), Immigrants from Taiwan (10.1%, a difference of 1.2%), Thai (10.2%, a difference of 2.1%), Immigrants from Bolivia (10.3%, a difference of 2.9%), and Bolivian (10.4%, a difference of 3.8%).
| Demographics | Rating | Rank | Female Disability |
| Immigrants | India | 100.0 /100 | #1 | Exceptional 10.0% |
| Filipinos | 100.0 /100 | #2 | Exceptional 10.1% |
| Immigrants | Taiwan | 100.0 /100 | #3 | Exceptional 10.1% |
| Thais | 100.0 /100 | #4 | Exceptional 10.2% |
| Immigrants | Bolivia | 100.0 /100 | #5 | Exceptional 10.3% |
| Bolivians | 100.0 /100 | #6 | Exceptional 10.4% |
| Immigrants | Singapore | 100.0 /100 | #7 | Exceptional 10.4% |
| Immigrants | South Central Asia | 100.0 /100 | #8 | Exceptional 10.5% |
| Iranians | 100.0 /100 | #9 | Exceptional 10.6% |
| Immigrants | Hong Kong | 100.0 /100 | #10 | Exceptional 10.6% |
| Immigrants | Korea | 100.0 /100 | #11 | Exceptional 10.6% |
| Immigrants | Israel | 100.0 /100 | #12 | Exceptional 10.7% |
| Immigrants | Eastern Asia | 100.0 /100 | #13 | Exceptional 10.7% |
| Immigrants | China | 100.0 /100 | #14 | Exceptional 10.7% |
| Burmese | 100.0 /100 | #15 | Exceptional 10.7% |