Yup'ik vs Immigrants from India 7th Grade
COMPARE
Yup'ik
Immigrants from India
7th Grade
7th Grade Comparison
Yup'ik
Immigrants from India
97.4%
7TH GRADE
100.0/ 100
METRIC RATING
20th/ 347
METRIC RANK
96.9%
7TH GRADE
99.6/ 100
METRIC RATING
68th/ 347
METRIC RANK
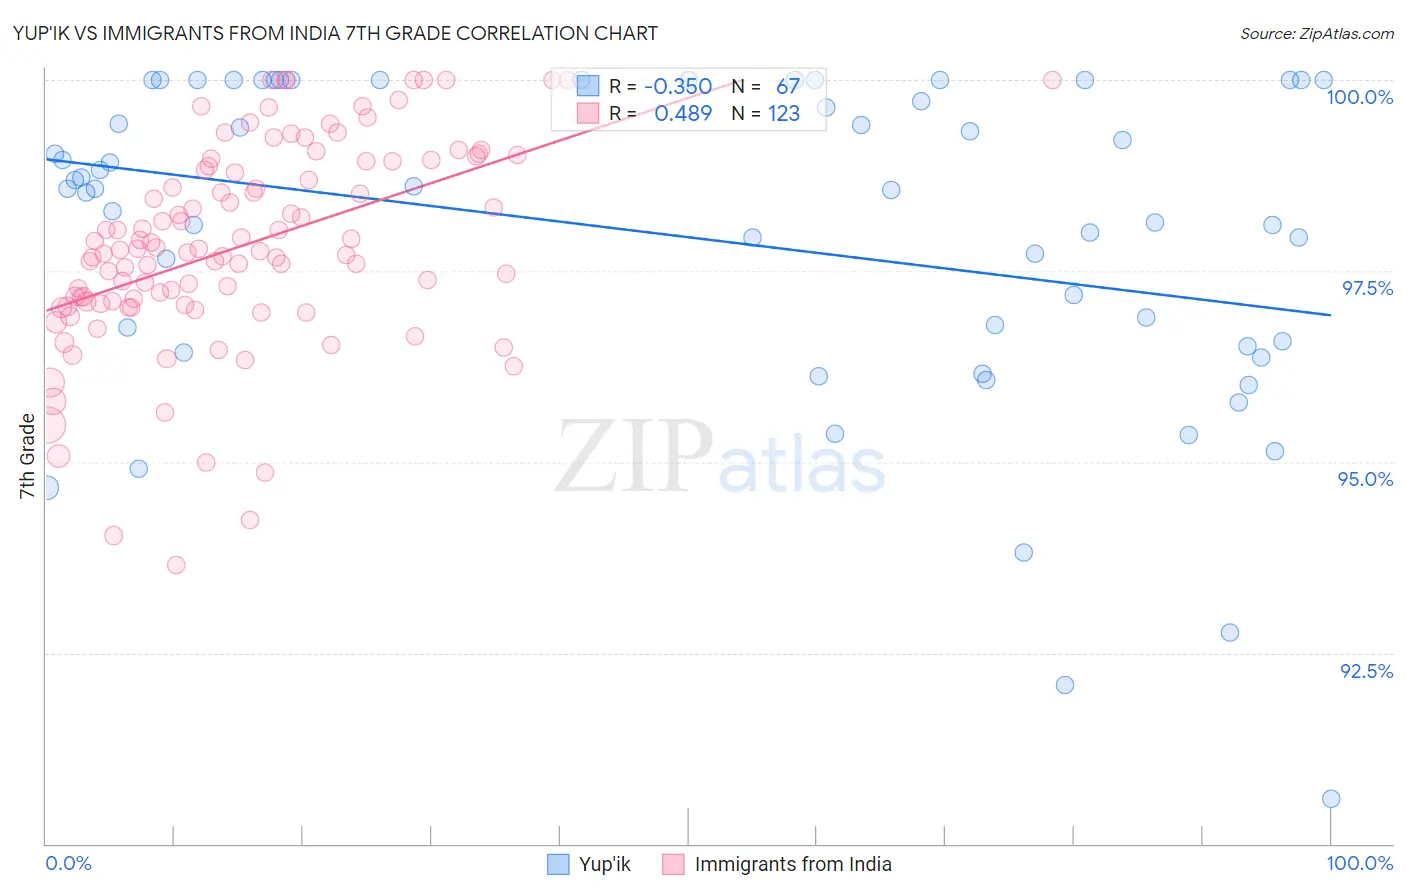
Yup'ik vs Immigrants from India 7th Grade Correlation Chart
The statistical analysis conducted on geographies consisting of 39,963,824 people shows a mild negative correlation between the proportion of Yup'ik and percentage of population with at least 7th grade education in the United States with a correlation coefficient (R) of -0.350 and weighted average of 97.4%. Similarly, the statistical analysis conducted on geographies consisting of 434,105,844 people shows a moderate positive correlation between the proportion of Immigrants from India and percentage of population with at least 7th grade education in the United States with a correlation coefficient (R) of 0.489 and weighted average of 96.9%, a difference of 0.60%.
7th Grade Correlation Summary
| Measurement | Yup'ik | Immigrants from India |
| Minimum | 90.6% | 93.7% |
| Maximum | 100.0% | 100.0% |
| Range | 9.4% | 6.3% |
| Mean | 97.9% | 97.8% |
| Median | 98.6% | 97.8% |
| Interquartile 25% (IQ1) | 96.5% | 97.1% |
| Interquartile 75% (IQ3) | 100.0% | 98.9% |
| Interquartile Range (IQR) | 3.5% | 1.9% |
| Standard Deviation (Sample) | 2.1% | 1.3% |
| Standard Deviation (Population) | 2.1% | 1.3% |
Similar Demographics by 7th Grade
Demographics Similar to Yup'ik by 7th Grade
In terms of 7th grade, the demographic groups most similar to Yup'ik are Inupiat (97.4%, a difference of 0.010%), French Canadian (97.4%, a difference of 0.020%), Croatian (97.4%, a difference of 0.030%), Lithuanian (97.5%, a difference of 0.040%), and Tlingit-Haida (97.5%, a difference of 0.050%).
| Demographics | Rating | Rank | 7th Grade |
| Swedes | 100.0 /100 | #13 | Exceptional 97.6% |
| Pennsylvania Germans | 100.0 /100 | #14 | Exceptional 97.6% |
| English | 100.0 /100 | #15 | Exceptional 97.6% |
| Irish | 100.0 /100 | #16 | Exceptional 97.5% |
| Scottish | 100.0 /100 | #17 | Exceptional 97.5% |
| Tlingit-Haida | 100.0 /100 | #18 | Exceptional 97.5% |
| Lithuanians | 100.0 /100 | #19 | Exceptional 97.5% |
| Yup'ik | 100.0 /100 | #20 | Exceptional 97.4% |
| Inupiat | 100.0 /100 | #21 | Exceptional 97.4% |
| French Canadians | 100.0 /100 | #22 | Exceptional 97.4% |
| Croatians | 100.0 /100 | #23 | Exceptional 97.4% |
| Welsh | 100.0 /100 | #24 | Exceptional 97.4% |
| French | 100.0 /100 | #25 | Exceptional 97.4% |
| Scotch-Irish | 100.0 /100 | #26 | Exceptional 97.4% |
| Danes | 100.0 /100 | #27 | Exceptional 97.4% |
Demographics Similar to Immigrants from India by 7th Grade
In terms of 7th grade, the demographic groups most similar to Immigrants from India are Ukrainian (96.9%, a difference of 0.020%), Native Hawaiian (96.9%, a difference of 0.020%), Iranian (96.8%, a difference of 0.020%), New Zealander (96.8%, a difference of 0.030%), and Immigrants from Lithuania (96.8%, a difference of 0.030%).
| Demographics | Rating | Rank | 7th Grade |
| Creek | 99.8 /100 | #61 | Exceptional 96.9% |
| Immigrants | North America | 99.8 /100 | #62 | Exceptional 96.9% |
| Immigrants | Northern Europe | 99.7 /100 | #63 | Exceptional 96.9% |
| Immigrants | Austria | 99.7 /100 | #64 | Exceptional 96.9% |
| Canadians | 99.7 /100 | #65 | Exceptional 96.9% |
| Ukrainians | 99.7 /100 | #66 | Exceptional 96.9% |
| Native Hawaiians | 99.7 /100 | #67 | Exceptional 96.9% |
| Immigrants | India | 99.6 /100 | #68 | Exceptional 96.9% |
| Iranians | 99.6 /100 | #69 | Exceptional 96.8% |
| New Zealanders | 99.6 /100 | #70 | Exceptional 96.8% |
| Immigrants | Lithuania | 99.6 /100 | #71 | Exceptional 96.8% |
| Cajuns | 99.5 /100 | #72 | Exceptional 96.8% |
| Arapaho | 99.5 /100 | #73 | Exceptional 96.8% |
| Immigrants | England | 99.5 /100 | #74 | Exceptional 96.8% |
| Zimbabweans | 99.5 /100 | #75 | Exceptional 96.8% |