Yugoslavian vs Dutch Female Disability
COMPARE
Yugoslavian
Dutch
Female Disability
Female Disability Comparison
Yugoslavians
Dutch
12.6%
FEMALE DISABILITY
3.7/ 100
METRIC RATING
238th/ 347
METRIC RANK
12.9%
FEMALE DISABILITY
0.2/ 100
METRIC RATING
271st/ 347
METRIC RANK
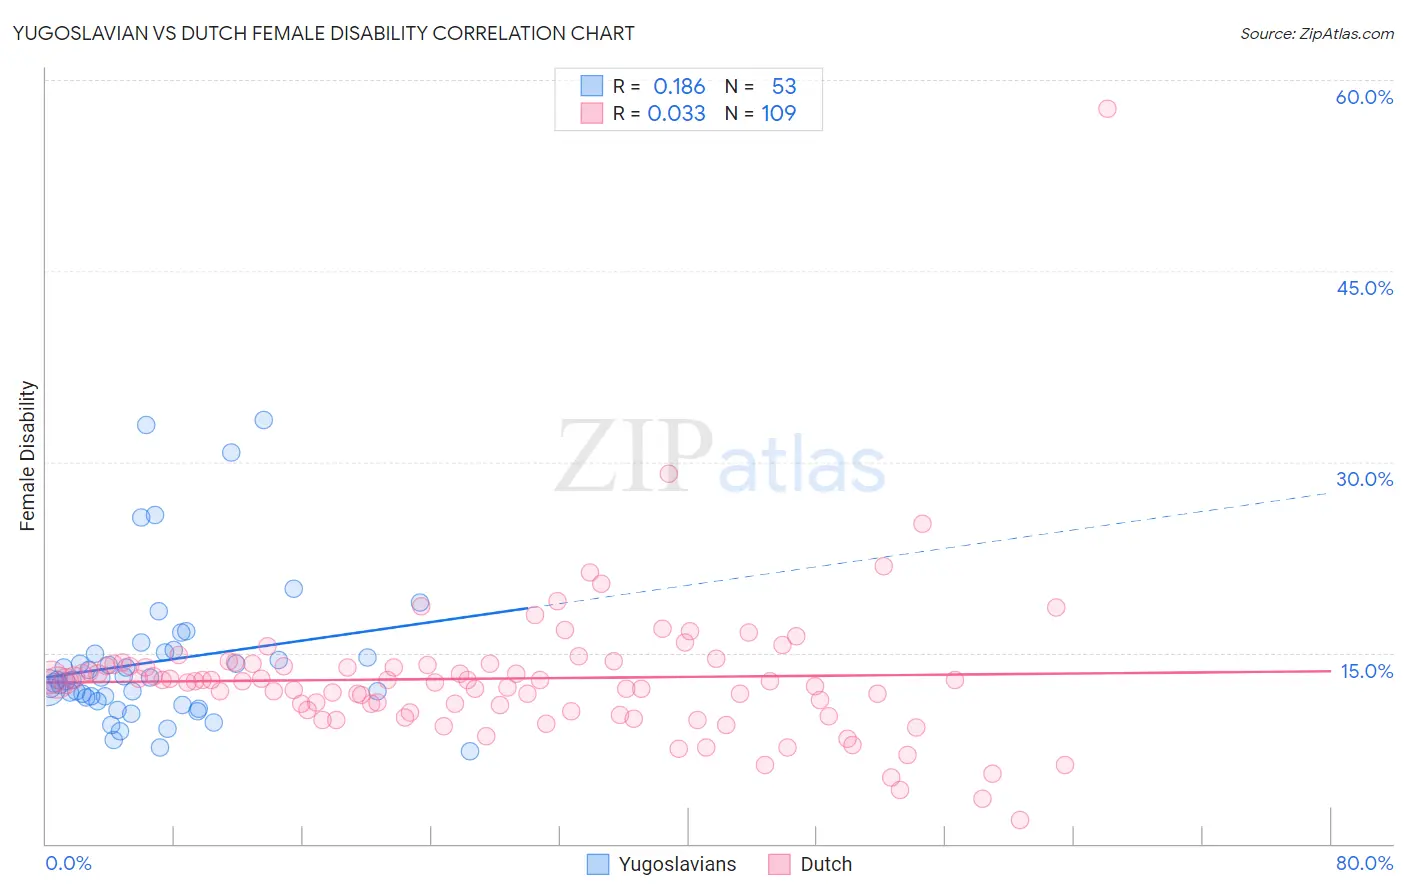
Yugoslavian vs Dutch Female Disability Correlation Chart
The statistical analysis conducted on geographies consisting of 285,691,291 people shows a poor positive correlation between the proportion of Yugoslavians and percentage of females with a disability in the United States with a correlation coefficient (R) of 0.186 and weighted average of 12.6%. Similarly, the statistical analysis conducted on geographies consisting of 554,147,365 people shows no correlation between the proportion of Dutch and percentage of females with a disability in the United States with a correlation coefficient (R) of 0.033 and weighted average of 12.9%, a difference of 2.8%.
Female Disability Correlation Summary
| Measurement | Yugoslavian | Dutch |
| Minimum | 7.3% | 1.9% |
| Maximum | 33.3% | 57.7% |
| Range | 26.1% | 55.9% |
| Mean | 14.3% | 13.0% |
| Median | 12.9% | 12.8% |
| Interquartile 25% (IQ1) | 11.4% | 10.5% |
| Interquartile 75% (IQ3) | 15.0% | 14.1% |
| Interquartile Range (IQR) | 3.6% | 3.7% |
| Standard Deviation (Sample) | 5.7% | 5.9% |
| Standard Deviation (Population) | 5.7% | 5.9% |
Similar Demographics by Female Disability
Demographics Similar to Yugoslavians by Female Disability
In terms of female disability, the demographic groups most similar to Yugoslavians are Slavic (12.6%, a difference of 0.030%), Barbadian (12.6%, a difference of 0.030%), German Russian (12.6%, a difference of 0.13%), Immigrants from West Indies (12.6%, a difference of 0.15%), and Malaysian (12.5%, a difference of 0.28%).
| Demographics | Rating | Rank | Female Disability |
| Belgians | 6.5 /100 | #231 | Tragic 12.5% |
| Immigrants | Somalia | 5.9 /100 | #232 | Tragic 12.5% |
| Immigrants | Iraq | 5.3 /100 | #233 | Tragic 12.5% |
| Scandinavians | 5.3 /100 | #234 | Tragic 12.5% |
| Malaysians | 5.0 /100 | #235 | Tragic 12.5% |
| Immigrants | West Indies | 4.4 /100 | #236 | Tragic 12.6% |
| Slavs | 3.8 /100 | #237 | Tragic 12.6% |
| Yugoslavians | 3.7 /100 | #238 | Tragic 12.6% |
| Barbadians | 3.6 /100 | #239 | Tragic 12.6% |
| German Russians | 3.2 /100 | #240 | Tragic 12.6% |
| Japanese | 2.7 /100 | #241 | Tragic 12.6% |
| Canadians | 2.6 /100 | #242 | Tragic 12.6% |
| Immigrants | Senegal | 2.5 /100 | #243 | Tragic 12.6% |
| Alsatians | 2.5 /100 | #244 | Tragic 12.6% |
| Immigrants | Jamaica | 2.2 /100 | #245 | Tragic 12.6% |
Demographics Similar to Dutch by Female Disability
In terms of female disability, the demographic groups most similar to Dutch are German (12.9%, a difference of 0.21%), Sioux (12.9%, a difference of 0.23%), Portuguese (13.0%, a difference of 0.35%), Cheyenne (13.0%, a difference of 0.40%), and Immigrants from Dominica (13.0%, a difference of 0.45%).
| Demographics | Rating | Rank | Female Disability |
| Alaska Natives | 0.6 /100 | #264 | Tragic 12.8% |
| West Indians | 0.5 /100 | #265 | Tragic 12.8% |
| Finns | 0.4 /100 | #266 | Tragic 12.8% |
| Senegalese | 0.4 /100 | #267 | Tragic 12.8% |
| Immigrants | Laos | 0.4 /100 | #268 | Tragic 12.8% |
| Indonesians | 0.4 /100 | #269 | Tragic 12.8% |
| Immigrants | Liberia | 0.3 /100 | #270 | Tragic 12.9% |
| Dutch | 0.2 /100 | #271 | Tragic 12.9% |
| Germans | 0.1 /100 | #272 | Tragic 12.9% |
| Sioux | 0.1 /100 | #273 | Tragic 12.9% |
| Portuguese | 0.1 /100 | #274 | Tragic 13.0% |
| Cheyenne | 0.1 /100 | #275 | Tragic 13.0% |
| Immigrants | Dominica | 0.1 /100 | #276 | Tragic 13.0% |
| Spanish | 0.1 /100 | #277 | Tragic 13.0% |
| Scottish | 0.1 /100 | #278 | Tragic 13.0% |