White/Caucasian vs Carpatho Rusyn Disability Age 35 to 64
COMPARE
White/Caucasian
Carpatho Rusyn
Disability Age 35 to 64
Disability Age 35 to 64 Comparison
Whites/Caucasians
Carpatho Rusyns
12.6%
DISABILITY AGE 35 TO 64
0.3/ 100
METRIC RATING
266th/ 347
METRIC RANK
11.5%
DISABILITY AGE 35 TO 64
25.3/ 100
METRIC RATING
195th/ 347
METRIC RANK
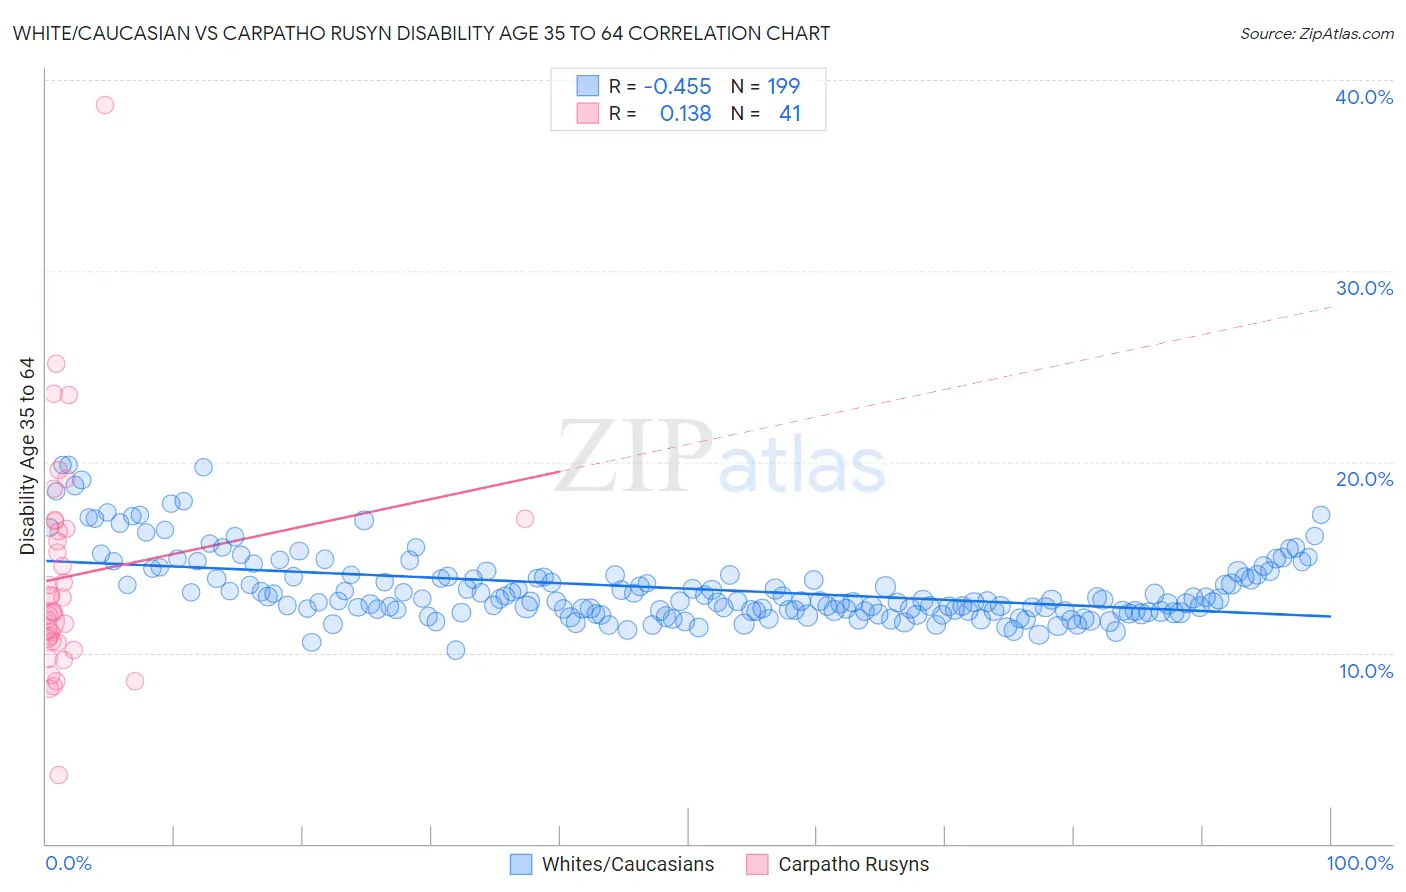
White/Caucasian vs Carpatho Rusyn Disability Age 35 to 64 Correlation Chart
The statistical analysis conducted on geographies consisting of 582,010,909 people shows a moderate negative correlation between the proportion of Whites/Caucasians and percentage of population with a disability between the ages 34 and 64 in the United States with a correlation coefficient (R) of -0.455 and weighted average of 12.6%. Similarly, the statistical analysis conducted on geographies consisting of 58,871,605 people shows a poor positive correlation between the proportion of Carpatho Rusyns and percentage of population with a disability between the ages 34 and 64 in the United States with a correlation coefficient (R) of 0.138 and weighted average of 11.5%, a difference of 9.6%.
Disability Age 35 to 64 Correlation Summary
| Measurement | White/Caucasian | Carpatho Rusyn |
| Minimum | 10.1% | 3.6% |
| Maximum | 19.8% | 38.7% |
| Range | 9.7% | 35.0% |
| Mean | 13.4% | 14.0% |
| Median | 12.7% | 12.2% |
| Interquartile 25% (IQ1) | 12.2% | 10.6% |
| Interquartile 75% (IQ3) | 14.0% | 16.7% |
| Interquartile Range (IQR) | 1.8% | 6.1% |
| Standard Deviation (Sample) | 1.8% | 6.0% |
| Standard Deviation (Population) | 1.8% | 5.9% |
Similar Demographics by Disability Age 35 to 64
Demographics Similar to Whites/Caucasians by Disability Age 35 to 64
In terms of disability age 35 to 64, the demographic groups most similar to Whites/Caucasians are Subsaharan African (12.6%, a difference of 0.16%), Immigrants from Dominica (12.7%, a difference of 0.34%), Spanish (12.7%, a difference of 0.44%), French (12.7%, a difference of 0.48%), and Marshallese (12.5%, a difference of 0.71%).
| Demographics | Rating | Rank | Disability Age 35 to 64 |
| English | 0.6 /100 | #259 | Tragic 12.4% |
| German Russians | 0.5 /100 | #260 | Tragic 12.5% |
| Malaysians | 0.5 /100 | #261 | Tragic 12.5% |
| Senegalese | 0.5 /100 | #262 | Tragic 12.5% |
| Immigrants | Zaire | 0.4 /100 | #263 | Tragic 12.5% |
| Immigrants | Portugal | 0.4 /100 | #264 | Tragic 12.5% |
| Marshallese | 0.4 /100 | #265 | Tragic 12.5% |
| Whites/Caucasians | 0.3 /100 | #266 | Tragic 12.6% |
| Sub-Saharan Africans | 0.2 /100 | #267 | Tragic 12.6% |
| Immigrants | Dominica | 0.2 /100 | #268 | Tragic 12.7% |
| Spanish | 0.2 /100 | #269 | Tragic 12.7% |
| French | 0.2 /100 | #270 | Tragic 12.7% |
| Nepalese | 0.1 /100 | #271 | Tragic 12.8% |
| U.S. Virgin Islanders | 0.1 /100 | #272 | Tragic 12.8% |
| Pennsylvania Germans | 0.1 /100 | #273 | Tragic 12.8% |
Demographics Similar to Carpatho Rusyns by Disability Age 35 to 64
In terms of disability age 35 to 64, the demographic groups most similar to Carpatho Rusyns are Iraqi (11.5%, a difference of 0.12%), Immigrants from Latin America (11.5%, a difference of 0.22%), Immigrants from Africa (11.5%, a difference of 0.37%), Norwegian (11.5%, a difference of 0.43%), and Immigrants from Iraq (11.6%, a difference of 0.48%).
| Demographics | Rating | Rank | Disability Age 35 to 64 |
| Northern Europeans | 34.9 /100 | #188 | Fair 11.4% |
| Hungarians | 34.6 /100 | #189 | Fair 11.4% |
| Immigrants | Nigeria | 32.5 /100 | #190 | Fair 11.4% |
| Swedes | 31.3 /100 | #191 | Fair 11.4% |
| Norwegians | 29.7 /100 | #192 | Fair 11.5% |
| Immigrants | Africa | 29.0 /100 | #193 | Fair 11.5% |
| Immigrants | Latin America | 27.5 /100 | #194 | Fair 11.5% |
| Carpatho Rusyns | 25.3 /100 | #195 | Fair 11.5% |
| Iraqis | 24.2 /100 | #196 | Fair 11.5% |
| Immigrants | Iraq | 21.0 /100 | #197 | Fair 11.6% |
| Immigrants | Panama | 20.4 /100 | #198 | Fair 11.6% |
| Basques | 19.5 /100 | #199 | Poor 11.6% |
| Swiss | 18.7 /100 | #200 | Poor 11.6% |
| Immigrants | Kenya | 17.7 /100 | #201 | Poor 11.6% |
| Immigrants | Guatemala | 17.5 /100 | #202 | Poor 11.6% |