Ukrainian vs Immigrants from Ukraine Vision Disability
COMPARE
Ukrainian
Immigrants from Ukraine
Vision Disability
Vision Disability Comparison
Ukrainians
Immigrants from Ukraine
2.1%
VISION DISABILITY
81.9/ 100
METRIC RATING
144th/ 347
METRIC RANK
2.1%
VISION DISABILITY
90.4/ 100
METRIC RATING
122nd/ 347
METRIC RANK
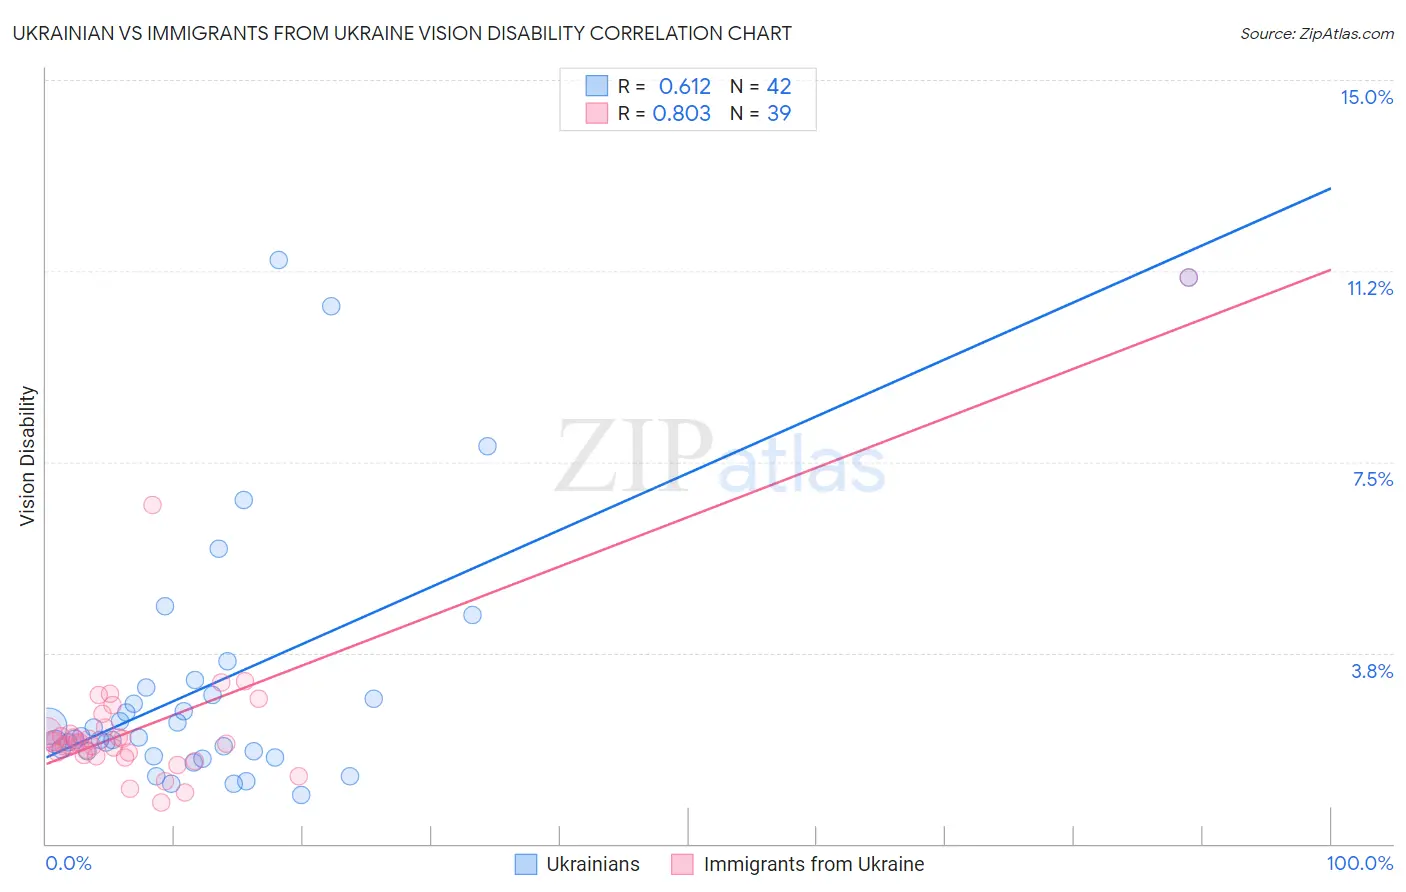
Ukrainian vs Immigrants from Ukraine Vision Disability Correlation Chart
The statistical analysis conducted on geographies consisting of 448,040,924 people shows a significant positive correlation between the proportion of Ukrainians and percentage of population with vision disability in the United States with a correlation coefficient (R) of 0.612 and weighted average of 2.1%. Similarly, the statistical analysis conducted on geographies consisting of 289,545,992 people shows a very strong positive correlation between the proportion of Immigrants from Ukraine and percentage of population with vision disability in the United States with a correlation coefficient (R) of 0.803 and weighted average of 2.1%, a difference of 1.2%.
Vision Disability Correlation Summary
| Measurement | Ukrainian | Immigrants from Ukraine |
| Minimum | 0.95% | 0.80% |
| Maximum | 11.5% | 11.1% |
| Range | 10.5% | 10.3% |
| Mean | 3.2% | 2.4% |
| Median | 2.1% | 2.0% |
| Interquartile 25% (IQ1) | 1.8% | 1.8% |
| Interquartile 75% (IQ3) | 3.1% | 2.3% |
| Interquartile Range (IQR) | 1.2% | 0.53% |
| Standard Deviation (Sample) | 2.6% | 1.7% |
| Standard Deviation (Population) | 2.6% | 1.7% |
Similar Demographics by Vision Disability
Demographics Similar to Ukrainians by Vision Disability
In terms of vision disability, the demographic groups most similar to Ukrainians are Immigrants from Bosnia and Herzegovina (2.1%, a difference of 0.040%), South American (2.1%, a difference of 0.11%), Immigrants from Sierra Leone (2.1%, a difference of 0.11%), Italian (2.1%, a difference of 0.23%), and Sierra Leonean (2.1%, a difference of 0.25%).
| Demographics | Rating | Rank | Vision Disability |
| Immigrants | South Eastern Asia | 86.3 /100 | #137 | Excellent 2.1% |
| Arabs | 86.3 /100 | #138 | Excellent 2.1% |
| Immigrants | Morocco | 85.2 /100 | #139 | Excellent 2.1% |
| Immigrants | Netherlands | 84.2 /100 | #140 | Excellent 2.1% |
| Sierra Leoneans | 84.1 /100 | #141 | Excellent 2.1% |
| South Americans | 82.8 /100 | #142 | Excellent 2.1% |
| Immigrants | Sierra Leone | 82.8 /100 | #143 | Excellent 2.1% |
| Ukrainians | 81.9 /100 | #144 | Excellent 2.1% |
| Immigrants | Bosnia and Herzegovina | 81.5 /100 | #145 | Excellent 2.1% |
| Italians | 79.7 /100 | #146 | Good 2.1% |
| Immigrants | Sudan | 78.4 /100 | #147 | Good 2.1% |
| Finns | 78.3 /100 | #148 | Good 2.1% |
| Colombians | 76.2 /100 | #149 | Good 2.1% |
| Belgians | 75.9 /100 | #150 | Good 2.1% |
| Immigrants | Norway | 75.5 /100 | #151 | Good 2.1% |
Demographics Similar to Immigrants from Ukraine by Vision Disability
In terms of vision disability, the demographic groups most similar to Immigrants from Ukraine are Immigrants from Albania (2.1%, a difference of 0.0%), Immigrants from Scotland (2.1%, a difference of 0.010%), Immigrants from Spain (2.1%, a difference of 0.11%), Immigrants from Venezuela (2.1%, a difference of 0.11%), and Immigrants from Zimbabwe (2.1%, a difference of 0.13%).
| Demographics | Rating | Rank | Vision Disability |
| Immigrants | Vietnam | 92.2 /100 | #115 | Exceptional 2.1% |
| Ugandans | 92.2 /100 | #116 | Exceptional 2.1% |
| Poles | 92.0 /100 | #117 | Exceptional 2.1% |
| Immigrants | Philippines | 91.4 /100 | #118 | Exceptional 2.1% |
| Immigrants | Uganda | 91.4 /100 | #119 | Exceptional 2.1% |
| Immigrants | Zimbabwe | 91.0 /100 | #120 | Exceptional 2.1% |
| Immigrants | Scotland | 90.4 /100 | #121 | Exceptional 2.1% |
| Immigrants | Ukraine | 90.4 /100 | #122 | Exceptional 2.1% |
| Immigrants | Albania | 90.4 /100 | #123 | Exceptional 2.1% |
| Immigrants | Spain | 89.8 /100 | #124 | Excellent 2.1% |
| Immigrants | Venezuela | 89.8 /100 | #125 | Excellent 2.1% |
| Immigrants | Peru | 89.5 /100 | #126 | Excellent 2.1% |
| Sudanese | 89.2 /100 | #127 | Excellent 2.1% |
| Immigrants | Chile | 89.0 /100 | #128 | Excellent 2.1% |
| Immigrants | Cameroon | 88.8 /100 | #129 | Excellent 2.1% |