Ukrainian vs Immigrants from Bangladesh Vision Disability
COMPARE
Ukrainian
Immigrants from Bangladesh
Vision Disability
Vision Disability Comparison
Ukrainians
Immigrants from Bangladesh
2.1%
VISION DISABILITY
81.9/ 100
METRIC RATING
144th/ 347
METRIC RANK
2.1%
VISION DISABILITY
65.5/ 100
METRIC RATING
164th/ 347
METRIC RANK
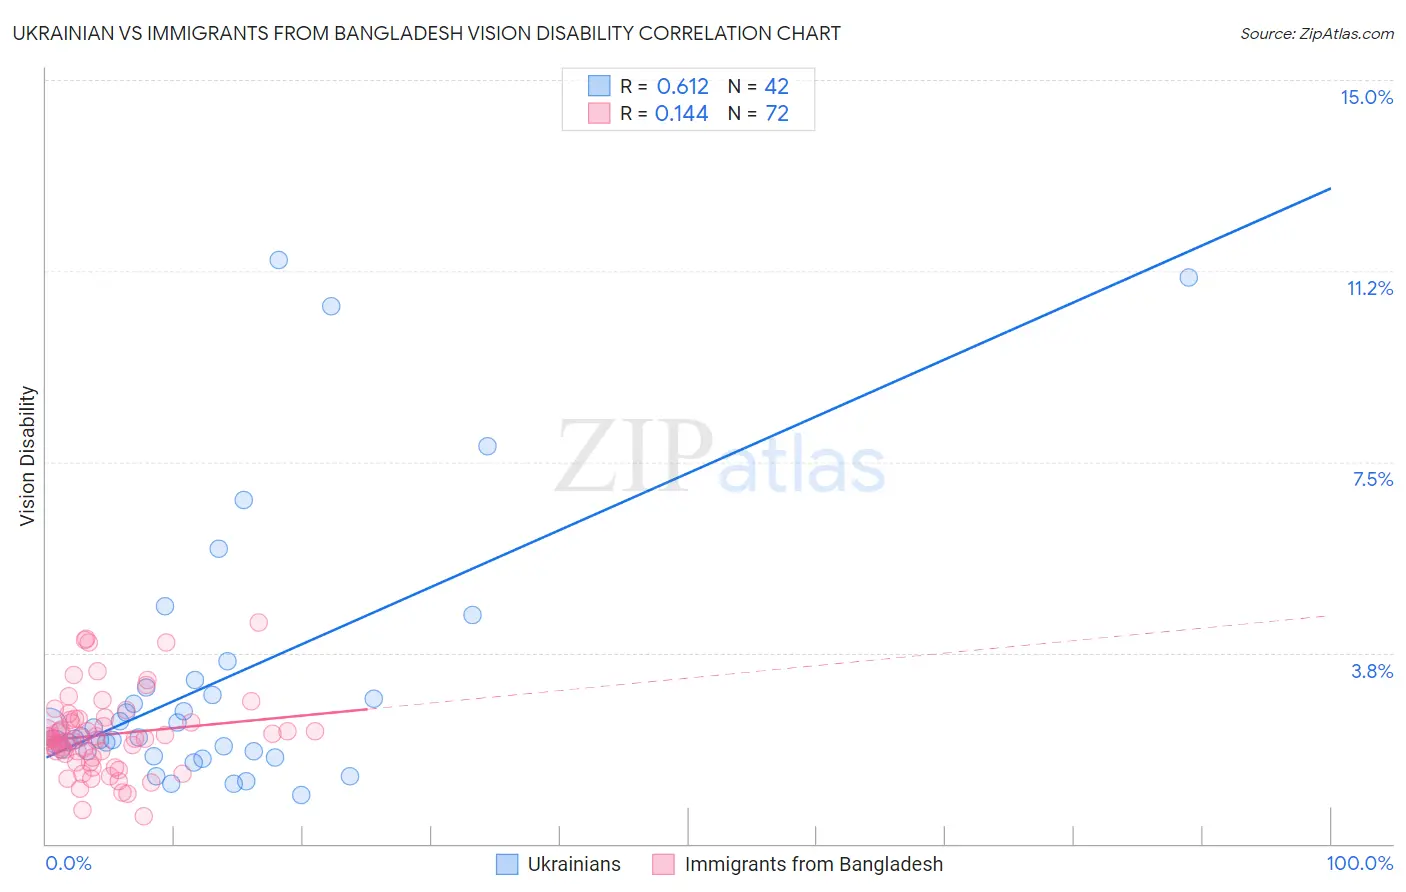
Ukrainian vs Immigrants from Bangladesh Vision Disability Correlation Chart
The statistical analysis conducted on geographies consisting of 448,040,924 people shows a significant positive correlation between the proportion of Ukrainians and percentage of population with vision disability in the United States with a correlation coefficient (R) of 0.612 and weighted average of 2.1%. Similarly, the statistical analysis conducted on geographies consisting of 203,575,590 people shows a poor positive correlation between the proportion of Immigrants from Bangladesh and percentage of population with vision disability in the United States with a correlation coefficient (R) of 0.144 and weighted average of 2.1%, a difference of 1.4%.
Vision Disability Correlation Summary
| Measurement | Ukrainian | Immigrants from Bangladesh |
| Minimum | 0.95% | 0.53% |
| Maximum | 11.5% | 4.4% |
| Range | 10.5% | 3.8% |
| Mean | 3.2% | 2.1% |
| Median | 2.1% | 2.1% |
| Interquartile 25% (IQ1) | 1.8% | 1.7% |
| Interquartile 75% (IQ3) | 3.1% | 2.4% |
| Interquartile Range (IQR) | 1.2% | 0.70% |
| Standard Deviation (Sample) | 2.6% | 0.78% |
| Standard Deviation (Population) | 2.6% | 0.77% |
Demographics Similar to Ukrainians and Immigrants from Bangladesh by Vision Disability
In terms of vision disability, the demographic groups most similar to Ukrainians are Immigrants from Bosnia and Herzegovina (2.1%, a difference of 0.040%), Italian (2.1%, a difference of 0.23%), Immigrants from Sudan (2.1%, a difference of 0.35%), Finnish (2.1%, a difference of 0.37%), and Colombian (2.1%, a difference of 0.55%). Similarly, the demographic groups most similar to Immigrants from Bangladesh are Icelander (2.1%, a difference of 0.040%), Hungarian (2.1%, a difference of 0.13%), Iraqi (2.1%, a difference of 0.16%), Austrian (2.1%, a difference of 0.25%), and South African (2.1%, a difference of 0.31%).
| Demographics | Rating | Rank | Vision Disability |
| Ukrainians | 81.9 /100 | #144 | Excellent 2.1% |
| Immigrants | Bosnia and Herzegovina | 81.5 /100 | #145 | Excellent 2.1% |
| Italians | 79.7 /100 | #146 | Good 2.1% |
| Immigrants | Sudan | 78.4 /100 | #147 | Good 2.1% |
| Finns | 78.3 /100 | #148 | Good 2.1% |
| Colombians | 76.2 /100 | #149 | Good 2.1% |
| Belgians | 75.9 /100 | #150 | Good 2.1% |
| Immigrants | Norway | 75.5 /100 | #151 | Good 2.1% |
| Immigrants | Southern Europe | 74.6 /100 | #152 | Good 2.1% |
| Immigrants | South America | 73.8 /100 | #153 | Good 2.1% |
| Slovenes | 73.6 /100 | #154 | Good 2.1% |
| Immigrants | Colombia | 72.1 /100 | #155 | Good 2.1% |
| Pakistanis | 71.6 /100 | #156 | Good 2.1% |
| Serbians | 70.2 /100 | #157 | Good 2.1% |
| Immigrants | Uzbekistan | 69.9 /100 | #158 | Good 2.1% |
| South Africans | 69.8 /100 | #159 | Good 2.1% |
| Austrians | 69.0 /100 | #160 | Good 2.1% |
| Iraqis | 67.7 /100 | #161 | Good 2.1% |
| Hungarians | 67.4 /100 | #162 | Good 2.1% |
| Icelanders | 66.1 /100 | #163 | Good 2.1% |
| Immigrants | Bangladesh | 65.5 /100 | #164 | Good 2.1% |