Immigrants from Israel vs Immigrants from Ukraine Vision Disability
COMPARE
Immigrants from Israel
Immigrants from Ukraine
Vision Disability
Vision Disability Comparison
Immigrants from Israel
Immigrants from Ukraine
1.8%
VISION DISABILITY
100.0/ 100
METRIC RATING
11th/ 347
METRIC RANK
2.1%
VISION DISABILITY
90.4/ 100
METRIC RATING
122nd/ 347
METRIC RANK
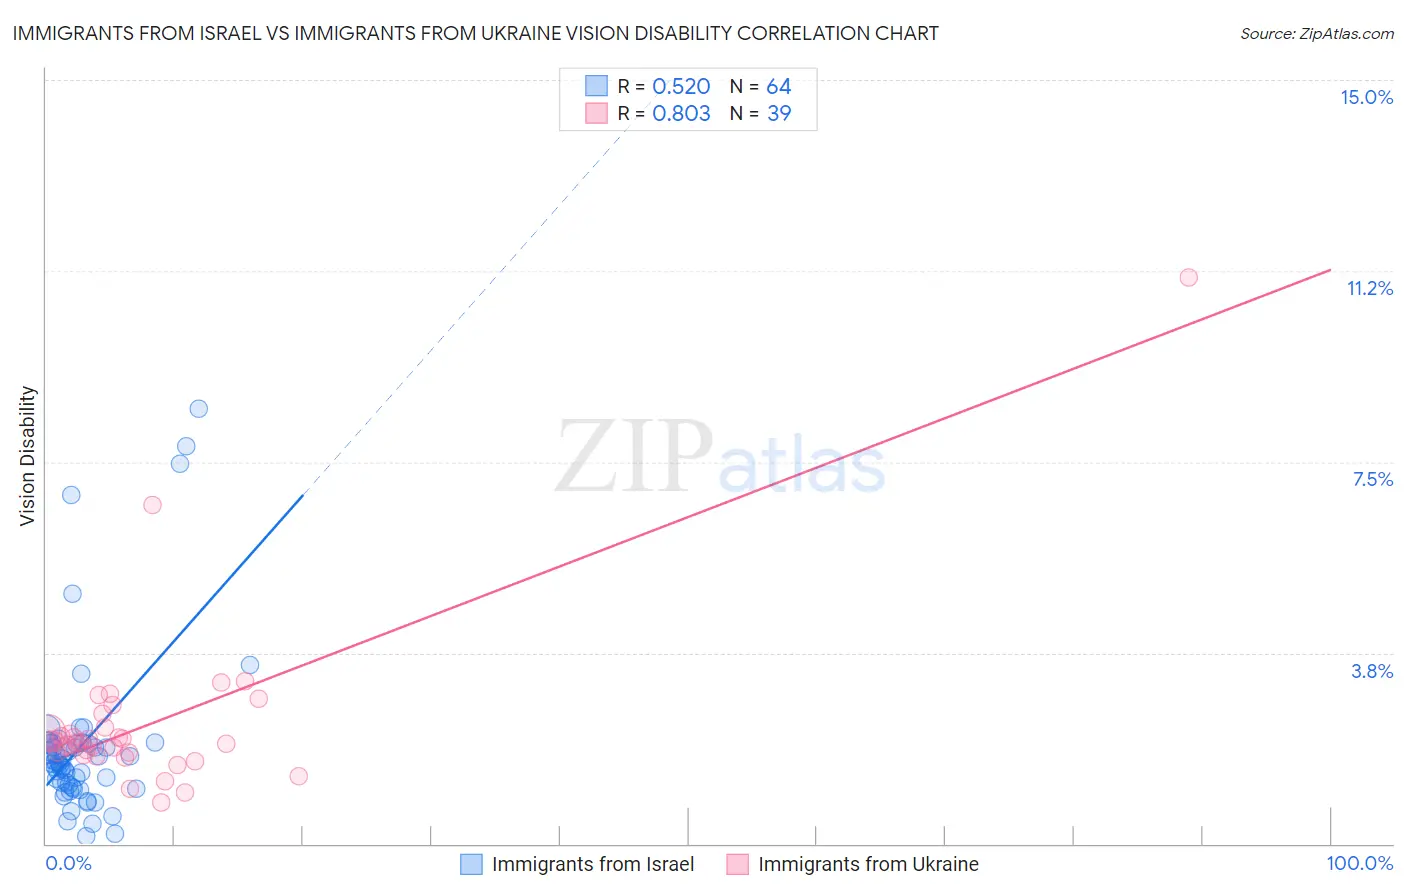
Immigrants from Israel vs Immigrants from Ukraine Vision Disability Correlation Chart
The statistical analysis conducted on geographies consisting of 209,958,644 people shows a substantial positive correlation between the proportion of Immigrants from Israel and percentage of population with vision disability in the United States with a correlation coefficient (R) of 0.520 and weighted average of 1.8%. Similarly, the statistical analysis conducted on geographies consisting of 289,545,992 people shows a very strong positive correlation between the proportion of Immigrants from Ukraine and percentage of population with vision disability in the United States with a correlation coefficient (R) of 0.803 and weighted average of 2.1%, a difference of 14.5%.
Vision Disability Correlation Summary
| Measurement | Immigrants from Israel | Immigrants from Ukraine |
| Minimum | 0.15% | 0.80% |
| Maximum | 8.5% | 11.1% |
| Range | 8.4% | 10.3% |
| Mean | 1.9% | 2.4% |
| Median | 1.6% | 2.0% |
| Interquartile 25% (IQ1) | 1.1% | 1.8% |
| Interquartile 75% (IQ3) | 2.0% | 2.3% |
| Interquartile Range (IQR) | 0.84% | 0.53% |
| Standard Deviation (Sample) | 1.7% | 1.7% |
| Standard Deviation (Population) | 1.7% | 1.7% |
Similar Demographics by Vision Disability
Demographics Similar to Immigrants from Israel by Vision Disability
In terms of vision disability, the demographic groups most similar to Immigrants from Israel are Immigrants from Korea (1.8%, a difference of 0.23%), Immigrants from Eastern Asia (1.8%, a difference of 0.31%), Immigrants from China (1.8%, a difference of 0.45%), Immigrants from Bolivia (1.8%, a difference of 0.88%), and Immigrants from Hong Kong (1.8%, a difference of 1.1%).
| Demographics | Rating | Rank | Vision Disability |
| Thais | 100.0 /100 | #4 | Exceptional 1.7% |
| Okinawans | 100.0 /100 | #5 | Exceptional 1.8% |
| Immigrants | Iran | 100.0 /100 | #6 | Exceptional 1.8% |
| Immigrants | South Central Asia | 100.0 /100 | #7 | Exceptional 1.8% |
| Iranians | 100.0 /100 | #8 | Exceptional 1.8% |
| Immigrants | Singapore | 100.0 /100 | #9 | Exceptional 1.8% |
| Immigrants | Hong Kong | 100.0 /100 | #10 | Exceptional 1.8% |
| Immigrants | Israel | 100.0 /100 | #11 | Exceptional 1.8% |
| Immigrants | Korea | 100.0 /100 | #12 | Exceptional 1.8% |
| Immigrants | Eastern Asia | 100.0 /100 | #13 | Exceptional 1.8% |
| Immigrants | China | 100.0 /100 | #14 | Exceptional 1.8% |
| Immigrants | Bolivia | 100.0 /100 | #15 | Exceptional 1.8% |
| Indians (Asian) | 100.0 /100 | #16 | Exceptional 1.8% |
| Burmese | 100.0 /100 | #17 | Exceptional 1.8% |
| Bolivians | 100.0 /100 | #18 | Exceptional 1.9% |
Demographics Similar to Immigrants from Ukraine by Vision Disability
In terms of vision disability, the demographic groups most similar to Immigrants from Ukraine are Immigrants from Albania (2.1%, a difference of 0.0%), Immigrants from Scotland (2.1%, a difference of 0.010%), Immigrants from Spain (2.1%, a difference of 0.11%), Immigrants from Venezuela (2.1%, a difference of 0.11%), and Immigrants from Zimbabwe (2.1%, a difference of 0.13%).
| Demographics | Rating | Rank | Vision Disability |
| Immigrants | Vietnam | 92.2 /100 | #115 | Exceptional 2.1% |
| Ugandans | 92.2 /100 | #116 | Exceptional 2.1% |
| Poles | 92.0 /100 | #117 | Exceptional 2.1% |
| Immigrants | Philippines | 91.4 /100 | #118 | Exceptional 2.1% |
| Immigrants | Uganda | 91.4 /100 | #119 | Exceptional 2.1% |
| Immigrants | Zimbabwe | 91.0 /100 | #120 | Exceptional 2.1% |
| Immigrants | Scotland | 90.4 /100 | #121 | Exceptional 2.1% |
| Immigrants | Ukraine | 90.4 /100 | #122 | Exceptional 2.1% |
| Immigrants | Albania | 90.4 /100 | #123 | Exceptional 2.1% |
| Immigrants | Spain | 89.8 /100 | #124 | Excellent 2.1% |
| Immigrants | Venezuela | 89.8 /100 | #125 | Excellent 2.1% |
| Immigrants | Peru | 89.5 /100 | #126 | Excellent 2.1% |
| Sudanese | 89.2 /100 | #127 | Excellent 2.1% |
| Immigrants | Chile | 89.0 /100 | #128 | Excellent 2.1% |
| Immigrants | Cameroon | 88.8 /100 | #129 | Excellent 2.1% |