Tlingit-Haida vs Immigrants Disability Age 18 to 34
COMPARE
Tlingit-Haida
Immigrants
Disability Age 18 to 34
Disability Age 18 to 34 Comparison
Tlingit-Haida
Immigrants
7.7%
DISABILITY AGE 18 TO 34
0.0/ 100
METRIC RATING
295th/ 347
METRIC RANK
6.2%
DISABILITY AGE 18 TO 34
97.6/ 100
METRIC RATING
93rd/ 347
METRIC RANK
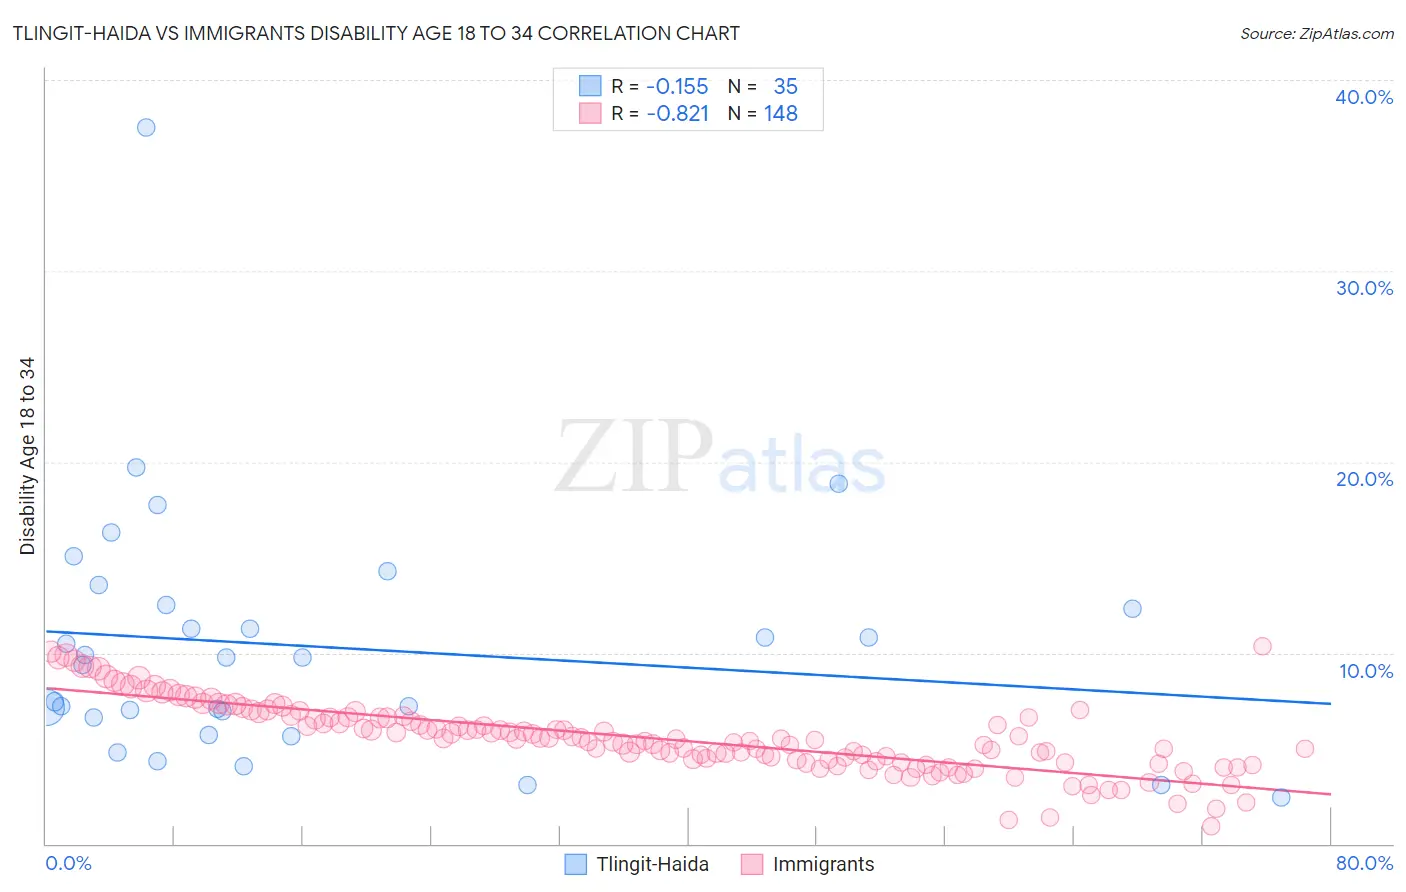
Tlingit-Haida vs Immigrants Disability Age 18 to 34 Correlation Chart
The statistical analysis conducted on geographies consisting of 60,778,142 people shows a poor negative correlation between the proportion of Tlingit-Haida and percentage of population with a disability between the ages 18 and 35 in the United States with a correlation coefficient (R) of -0.155 and weighted average of 7.7%. Similarly, the statistical analysis conducted on geographies consisting of 571,309,041 people shows a very strong negative correlation between the proportion of Immigrants and percentage of population with a disability between the ages 18 and 35 in the United States with a correlation coefficient (R) of -0.821 and weighted average of 6.2%, a difference of 24.5%.
Disability Age 18 to 34 Correlation Summary
| Measurement | Tlingit-Haida | Immigrants |
| Minimum | 2.4% | 0.92% |
| Maximum | 37.5% | 10.3% |
| Range | 35.1% | 9.4% |
| Mean | 10.3% | 5.6% |
| Median | 9.7% | 5.5% |
| Interquartile 25% (IQ1) | 6.6% | 4.4% |
| Interquartile 75% (IQ3) | 12.5% | 6.6% |
| Interquartile Range (IQR) | 5.9% | 2.3% |
| Standard Deviation (Sample) | 6.5% | 1.8% |
| Standard Deviation (Population) | 6.4% | 1.8% |
Similar Demographics by Disability Age 18 to 34
Demographics Similar to Tlingit-Haida by Disability Age 18 to 34
In terms of disability age 18 to 34, the demographic groups most similar to Tlingit-Haida are Immigrants from Cabo Verde (7.7%, a difference of 0.010%), Scandinavian (7.7%, a difference of 0.16%), Cape Verdean (7.7%, a difference of 0.18%), Pueblo (7.7%, a difference of 0.19%), and Black/African American (7.7%, a difference of 0.22%).
| Demographics | Rating | Rank | Disability Age 18 to 34 |
| Whites/Caucasians | 0.0 /100 | #288 | Tragic 7.6% |
| Immigrants | Nonimmigrants | 0.0 /100 | #289 | Tragic 7.6% |
| Slovaks | 0.0 /100 | #290 | Tragic 7.7% |
| Irish | 0.0 /100 | #291 | Tragic 7.7% |
| Blacks/African Americans | 0.0 /100 | #292 | Tragic 7.7% |
| Scandinavians | 0.0 /100 | #293 | Tragic 7.7% |
| Immigrants | Cabo Verde | 0.0 /100 | #294 | Tragic 7.7% |
| Tlingit-Haida | 0.0 /100 | #295 | Tragic 7.7% |
| Cape Verdeans | 0.0 /100 | #296 | Tragic 7.7% |
| Pueblo | 0.0 /100 | #297 | Tragic 7.7% |
| Dutch | 0.0 /100 | #298 | Tragic 7.7% |
| Germans | 0.0 /100 | #299 | Tragic 7.7% |
| Scottish | 0.0 /100 | #300 | Tragic 7.7% |
| Pima | 0.0 /100 | #301 | Tragic 7.7% |
| Welsh | 0.0 /100 | #302 | Tragic 7.7% |
Demographics Similar to Immigrants by Disability Age 18 to 34
In terms of disability age 18 to 34, the demographic groups most similar to Immigrants are Jordanian (6.2%, a difference of 0.030%), Immigrants from Kazakhstan (6.2%, a difference of 0.050%), Immigrants from Philippines (6.2%, a difference of 0.070%), Central American (6.2%, a difference of 0.080%), and Immigrants from Uruguay (6.2%, a difference of 0.12%).
| Demographics | Rating | Rank | Disability Age 18 to 34 |
| Immigrants | Kuwait | 98.0 /100 | #86 | Exceptional 6.2% |
| Immigrants | Eastern Europe | 97.9 /100 | #87 | Exceptional 6.2% |
| Cambodians | 97.8 /100 | #88 | Exceptional 6.2% |
| Turks | 97.8 /100 | #89 | Exceptional 6.2% |
| Immigrants | Vietnam | 97.7 /100 | #90 | Exceptional 6.2% |
| Immigrants | Philippines | 97.6 /100 | #91 | Exceptional 6.2% |
| Jordanians | 97.6 /100 | #92 | Exceptional 6.2% |
| Immigrants | Immigrants | 97.6 /100 | #93 | Exceptional 6.2% |
| Immigrants | Kazakhstan | 97.5 /100 | #94 | Exceptional 6.2% |
| Central Americans | 97.5 /100 | #95 | Exceptional 6.2% |
| Immigrants | Uruguay | 97.4 /100 | #96 | Exceptional 6.2% |
| Uruguayans | 97.3 /100 | #97 | Exceptional 6.2% |
| Immigrants | Syria | 97.2 /100 | #98 | Exceptional 6.2% |
| Immigrants | Ethiopia | 96.9 /100 | #99 | Exceptional 6.2% |
| Immigrants | Albania | 96.7 /100 | #100 | Exceptional 6.2% |