Thai vs Armenian Cognitive Disability

COMPARE

Thai
Race
Ancestry
AfghanAfricanAlaska NativeAlaskan AthabascanAlbanianAleutAlsatianAmericanApacheArabArapahoArgentineanAssyrian/Chaldean/SyriacAustralianAustrianBahamianBangladeshiBarbadianBasqueBelgianBelizeanBermudanBhutaneseBlackfeetBolivianBrazilianBritishBritish West IndianBulgarianBurmeseCajunCambodianCanadianCape VerdeanCarpatho RusynCelticCentral AmericanCentral American IndianCherokeeCheyenneChickasawChileanChineseChippewaChoctawColombianColvilleComancheCosta RicanCreeCreekCroatianCrowCubanCypriotCzechCzechoslovakianDanishDelawareDominicanDutchDutch West IndianEastern EuropeanEcuadorianEgyptianEnglishEstonianEthiopianEuropeanFijianFilipinoFinnishFrenchFrench American IndianFrench CanadianGermanGerman RussianGhanaianGreekGuamanian/ChamorroGuatemalanGuyaneseHaitianHmongHonduranHopiHoumaHungarianIcelanderIndian (Asian)IndonesianInupiatIranianIraqiIrishIroquoisIsraeliItalianJamaicanJapaneseJordanianKenyanKiowaKoreanLaotianLatvianLebaneseLiberianLithuanianLumbeeLuxembourgerMacedonianMalaysianMalteseMarshalleseMenomineeMexicanMexican American IndianMongolianMoroccanNative HawaiianNavajoNepaleseNew ZealanderNicaraguanNigerianNorthern EuropeanNorwegianOkinawanOsageOttawaPaiutePakistaniPalestinianPanamanianParaguayanPennsylvania GermanPeruvianPimaPolishPortuguesePotawatomiPuebloPuerto RicanPuget Sound SalishRomanianRussianSalvadoranSamoanScandinavianScotch-IrishScottishSeminoleSenegaleseSerbianShoshoneSierra LeoneanSiouxSlavicSlovakSloveneSomaliSouth AfricanSouth AmericanSouth American IndianSoviet UnionSpaniardSpanishSpanish AmericanSpanish American IndianSri LankanSubsaharan AfricanSudaneseSwedishSwissSyrianTaiwaneseThaiTlingit-HaidaTohono O'OdhamTonganTrinidadian and TobagonianTsimshianTurkishU.S. Virgin IslanderUgandanUkrainianUruguayanUteVenezuelanVietnameseWelshWest IndianYakamaYaquiYugoslavianYumanYup'ikZimbabwean
Immigration
NonimmigrantsImmigrantsAfghanistanAfricaAlbaniaArgentinaArmeniaAsiaAustraliaAustriaBahamasBangladeshBarbadosBelarusBelgiumBelizeBoliviaBosnia and HerzegovinaBrazilBulgariaBurma/MyanmarCabo VerdeCambodiaCameroonCanadaCaribbeanCentral AmericaChileChinaColombiaCongoCosta RicaCroatiaCubaCzechoslovakiaDenmarkDominicaDominican RepublicEastern AfricaEastern AsiaEastern EuropeEcuadorEgyptEl SalvadorEnglandEritreaEthiopiaEuropeFijiFranceGermanyGhanaGreeceGrenadaGuatemalaGuyanaHaitiHondurasHong KongHungaryIndiaIndonesiaIranIraqIrelandIsraelItalyJamaicaJapanJordanKazakhstanKenyaKoreaKuwaitLaosLatin AmericaLatviaLebanonLiberiaLithuaniaMalaysiaMexicoMicronesiaMiddle AfricaMoldovaMoroccoNepalNetherlandsNicaraguaNigeriaNorth AmericaNorth MacedoniaNorthern AfricaNorthern EuropeNorwayOceaniaPakistanPanamaPeruPhilippinesPolandPortugalRomaniaRussiaSaudi ArabiaScotlandSenegalSerbiaSierra LeoneSingaporeSomaliaSouth AfricaSouth AmericaSouth Central AsiaSouth Eastern AsiaSouthern EuropeSpainSri LankaSt. Vincent and the GrenadinesSudanSwedenSwitzerlandSyriaTaiwanThailandTrinidad and TobagoTurkeyUgandaUkraineUruguayUzbekistanVenezuelaVietnamWest IndiesWestern AfricaWestern AsiaWestern EuropeYemenZaireZimbabweAzores
Armenian
Race
Ancestry
AfghanAfricanAlaska NativeAlaskan AthabascanAlbanianAleutAlsatianAmericanApacheArabArapahoArgentineanArmenianAssyrian/Chaldean/SyriacAustralianAustrianBahamianBangladeshiBarbadianBasqueBelgianBelizeanBermudanBhutaneseBlackfeetBolivianBrazilianBritishBritish West IndianBulgarianBurmeseCajunCambodianCanadianCape VerdeanCarpatho RusynCelticCentral AmericanCentral American IndianCherokeeCheyenneChickasawChileanChineseChippewaChoctawColombianColvilleComancheCosta RicanCreeCreekCroatianCrowCubanCypriotCzechCzechoslovakianDanishDelawareDominicanDutchDutch West IndianEastern EuropeanEcuadorianEgyptianEnglishEstonianEthiopianEuropeanFijianFilipinoFinnishFrenchFrench American IndianFrench CanadianGermanGerman RussianGhanaianGreekGuamanian/ChamorroGuatemalanGuyaneseHaitianHmongHonduranHopiHoumaHungarianIcelanderIndian (Asian)IndonesianInupiatIranianIraqiIrishIroquoisIsraeliItalianJamaicanJapaneseJordanianKenyanKiowaKoreanLaotianLatvianLebaneseLiberianLithuanianLumbeeLuxembourgerMacedonianMalaysianMalteseMarshalleseMenomineeMexicanMexican American IndianMongolianMoroccanNative HawaiianNavajoNepaleseNew ZealanderNicaraguanNigerianNorthern EuropeanNorwegianOkinawanOsageOttawaPaiutePakistaniPalestinianPanamanianParaguayanPennsylvania GermanPeruvianPimaPolishPortuguesePotawatomiPuebloPuerto RicanPuget Sound SalishRomanianRussianSalvadoranSamoanScandinavianScotch-IrishScottishSeminoleSenegaleseSerbianShoshoneSierra LeoneanSiouxSlavicSlovakSloveneSomaliSouth AfricanSouth AmericanSouth American IndianSoviet UnionSpaniardSpanishSpanish AmericanSpanish American IndianSri LankanSubsaharan AfricanSudaneseSwedishSwissSyrianTaiwaneseTlingit-HaidaTohono O'OdhamTonganTrinidadian and TobagonianTsimshianTurkishU.S. Virgin IslanderUgandanUkrainianUruguayanUteVenezuelanVietnameseWelshWest IndianYakamaYaquiYugoslavianYumanYup'ikZimbabwean
Immigration
NonimmigrantsImmigrantsAfghanistanAfricaAlbaniaArgentinaArmeniaAsiaAustraliaAustriaBahamasBangladeshBarbadosBelarusBelgiumBelizeBoliviaBosnia and HerzegovinaBrazilBulgariaBurma/MyanmarCabo VerdeCambodiaCameroonCanadaCaribbeanCentral AmericaChileChinaColombiaCongoCosta RicaCroatiaCubaCzechoslovakiaDenmarkDominicaDominican RepublicEastern AfricaEastern AsiaEastern EuropeEcuadorEgyptEl SalvadorEnglandEritreaEthiopiaEuropeFijiFranceGermanyGhanaGreeceGrenadaGuatemalaGuyanaHaitiHondurasHong KongHungaryIndiaIndonesiaIranIraqIrelandIsraelItalyJamaicaJapanJordanKazakhstanKenyaKoreaKuwaitLaosLatin AmericaLatviaLebanonLiberiaLithuaniaMalaysiaMexicoMicronesiaMiddle AfricaMoldovaMoroccoNepalNetherlandsNicaraguaNigeriaNorth AmericaNorth MacedoniaNorthern AfricaNorthern EuropeNorwayOceaniaPakistanPanamaPeruPhilippinesPolandPortugalRomaniaRussiaSaudi ArabiaScotlandSenegalSerbiaSierra LeoneSingaporeSomaliaSouth AfricaSouth AmericaSouth Central AsiaSouth Eastern AsiaSouthern EuropeSpainSri LankaSt. Vincent and the GrenadinesSudanSwedenSwitzerlandSyriaTaiwanThailandTrinidad and TobagoTurkeyUgandaUkraineUruguayUzbekistanVenezuelaVietnamWest IndiesWestern AfricaWestern AsiaWestern EuropeYemenZaireZimbabweAzores
Cognitive Disability
Income
Poverty
Unemployment
Labor Participation
Family Structure
Vehicle Availability
Education Level
Disability

Cognitive Disability Comparison

Thais

Armenians

Exceptional
Good
16.1%
COGNITIVE DISABILITY
100.0/ 100
METRIC RATING
6th/ 347
METRIC RANK
17.2%
COGNITIVE DISABILITY
70.1/ 100
METRIC RATING
164th/ 347
METRIC RANK

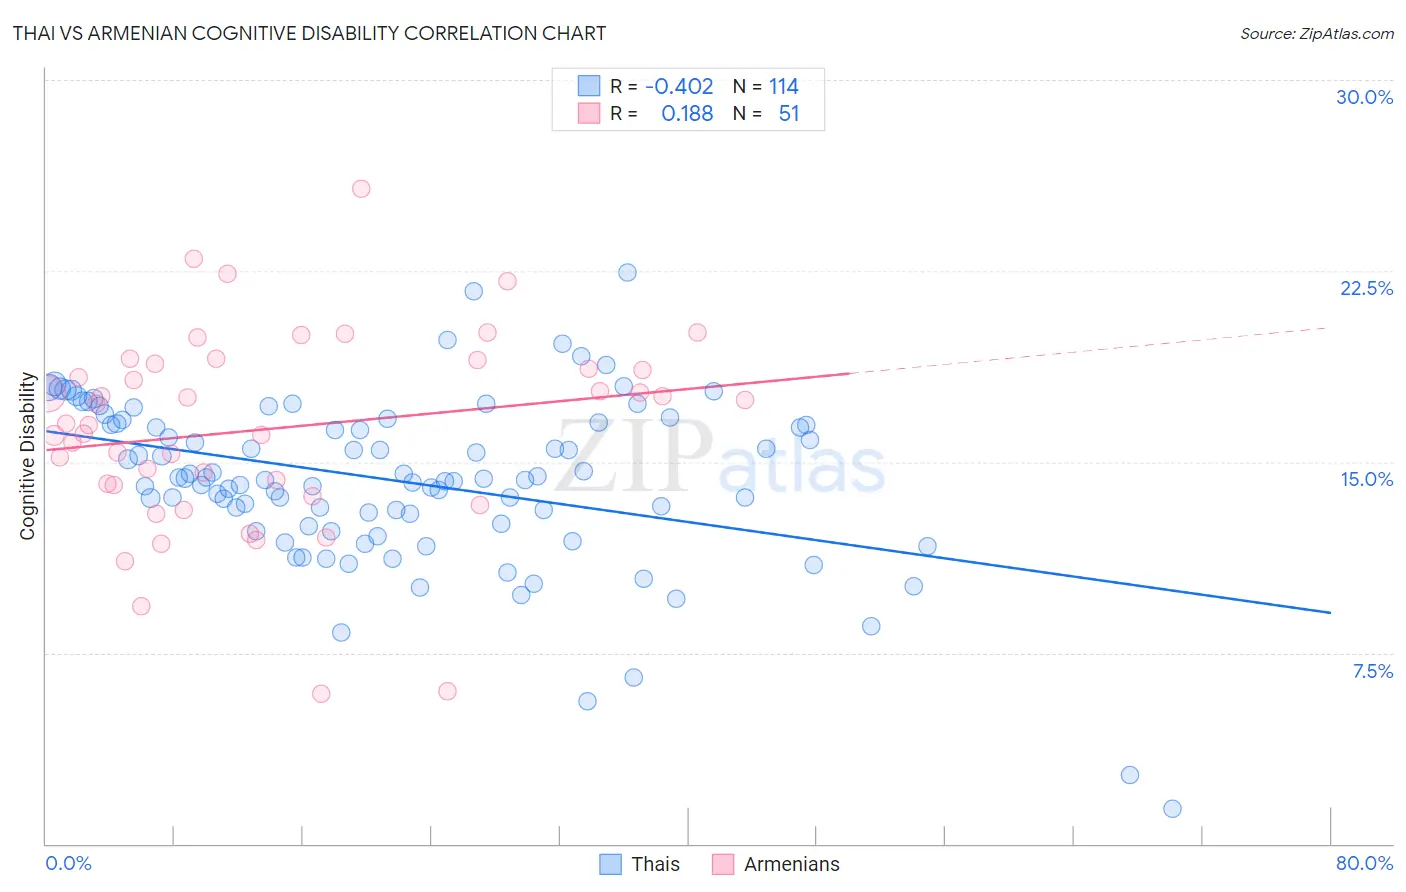
Thai vs Armenian Cognitive Disability Correlation Chart

The statistical analysis conducted on geographies consisting of 475,822,165 people shows a moderate negative correlation between the proportion of Thais and percentage of population with cognitive disability in the United States with a correlation coefficient (R) of -0.402 and weighted average of 16.1%. Similarly, the statistical analysis conducted on geographies consisting of 310,934,651 people shows a poor positive correlation between the proportion of Armenians and percentage of population with cognitive disability in the United States with a correlation coefficient (R) of 0.188 and weighted average of 17.2%, a difference of 6.5%.
Thai vs Armenian Cognitive Disability

Cognitive Disability Correlation Summary

MeasurementThaiArmenian
Minimum1.4%5.9%
Maximum22.4%25.7%
Range21.1%19.9%
Mean14.3%16.3%
Median14.3%16.5%
Interquartile 25% (IQ1)12.6%14.1%
Interquartile 75% (IQ3)16.5%18.8%
Interquartile Range (IQR)3.9%4.8%
Standard Deviation (Sample)3.3%3.9%
Standard Deviation (Population)3.3%3.9%

Similar Demographics by Cognitive Disability

Demographics Similar to Thais by Cognitive Disability

In terms of cognitive disability, the demographic groups most similar to Thais are Immigrants from Ireland (16.1%, a difference of 0.11%), Immigrants from Poland (16.1%, a difference of 0.13%), Assyrian/Chaldean/Syriac (16.2%, a difference of 0.45%), Immigrants from Scotland (16.2%, a difference of 0.50%), and Immigrants from Czechoslovakia (16.2%, a difference of 0.58%).
DemographicsRating | RankCognitive Disability
Immigrants | Taiwan
100.0
/100
|
#1
Exceptional
15.7%
Immigrants | India
100.0
/100
|
#2
Exceptional
15.9%
Chinese
100.0
/100
|
#3
Exceptional
15.9%
Immigrants | Lithuania
100.0
/100
|
#4
Exceptional
16.0%
Immigrants | Hong Kong
100.0
/100
|
#5
Exceptional
16.0%
Thais
100.0
/100
|
#6
Exceptional
16.1%
Immigrants | Ireland
100.0
/100
|
#7
Exceptional
16.1%
Immigrants | Poland
100.0
/100
|
#8
Exceptional
16.1%
Assyrians/Chaldeans/Syriacs
100.0
/100
|
#9
Exceptional
16.2%
Immigrants | Scotland
100.0
/100
|
#10
Exceptional
16.2%
Immigrants | Czechoslovakia
100.0
/100
|
#11
Exceptional
16.2%
Maltese
100.0
/100
|
#12
Exceptional
16.2%
Lithuanians
100.0
/100
|
#13
Exceptional
16.3%
Immigrants | Austria
100.0
/100
|
#14
Exceptional
16.3%
Immigrants | Greece
100.0
/100
|
#15
Exceptional
16.3%

Demographics Similar to Armenians by Cognitive Disability

In terms of cognitive disability, the demographic groups most similar to Armenians are Yugoslavian (17.2%, a difference of 0.050%), Immigrants from Switzerland (17.2%, a difference of 0.050%), American (17.2%, a difference of 0.070%), Australian (17.2%, a difference of 0.080%), and Immigrants from Latvia (17.2%, a difference of 0.11%).
DemographicsRating | RankCognitive Disability
Immigrants | Australia
76.0
/100
|
#157
Good
17.1%
Celtics
74.1
/100
|
#158
Good
17.1%
Immigrants | Latvia
73.2
/100
|
#159
Good
17.2%
Australians
72.4
/100
|
#160
Good
17.2%
Americans
72.2
/100
|
#161
Good
17.2%
Yugoslavians
71.6
/100
|
#162
Good
17.2%
Immigrants | Switzerland
71.5
/100
|
#163
Good
17.2%
Armenians
70.1
/100
|
#164
Good
17.2%
Immigrants | Albania
64.9
/100
|
#165
Good
17.2%
Immigrants | Ecuador
64.4
/100
|
#166
Good
17.2%
Immigrants | Syria
63.5
/100
|
#167
Good
17.2%
Immigrants | Immigrants
62.5
/100
|
#168
Good
17.2%
Immigrants | Portugal
61.8
/100
|
#169
Good
17.2%
Ecuadorians
59.6
/100
|
#170
Average
17.2%
Tlingit-Haida
59.4
/100
|
#171
Average
17.2%