Immigrants from Jamaica vs Armenian Cognitive Disability
COMPARE
Immigrants from Jamaica
Armenian
Cognitive Disability
Cognitive Disability Comparison
Immigrants from Jamaica
Armenians
17.6%
COGNITIVE DISABILITY
8.5/ 100
METRIC RATING
210th/ 347
METRIC RANK
17.2%
COGNITIVE DISABILITY
70.1/ 100
METRIC RATING
164th/ 347
METRIC RANK
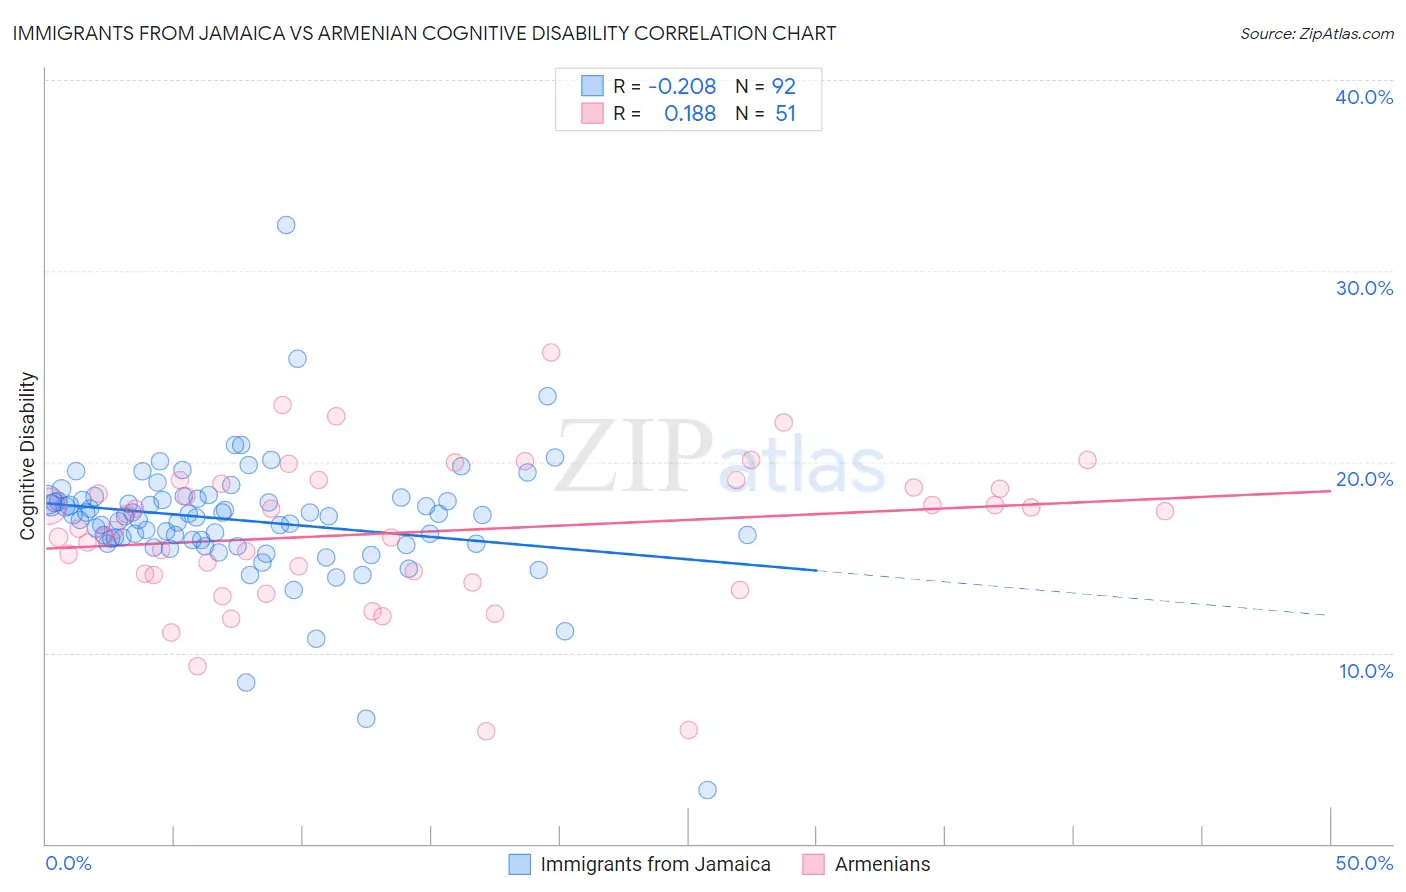
Immigrants from Jamaica vs Armenian Cognitive Disability Correlation Chart
The statistical analysis conducted on geographies consisting of 301,744,234 people shows a weak negative correlation between the proportion of Immigrants from Jamaica and percentage of population with cognitive disability in the United States with a correlation coefficient (R) of -0.208 and weighted average of 17.6%. Similarly, the statistical analysis conducted on geographies consisting of 310,934,651 people shows a poor positive correlation between the proportion of Armenians and percentage of population with cognitive disability in the United States with a correlation coefficient (R) of 0.188 and weighted average of 17.2%, a difference of 2.3%.
Cognitive Disability Correlation Summary
| Measurement | Immigrants from Jamaica | Armenian |
| Minimum | 2.8% | 5.9% |
| Maximum | 32.4% | 25.7% |
| Range | 29.6% | 19.9% |
| Mean | 16.9% | 16.3% |
| Median | 17.2% | 16.5% |
| Interquartile 25% (IQ1) | 15.8% | 14.1% |
| Interquartile 75% (IQ3) | 18.0% | 18.8% |
| Interquartile Range (IQR) | 2.2% | 4.8% |
| Standard Deviation (Sample) | 3.4% | 3.9% |
| Standard Deviation (Population) | 3.4% | 3.9% |
Similar Demographics by Cognitive Disability
Demographics Similar to Immigrants from Jamaica by Cognitive Disability
In terms of cognitive disability, the demographic groups most similar to Immigrants from Jamaica are Immigrants from Trinidad and Tobago (17.6%, a difference of 0.020%), Immigrants from Cameroon (17.6%, a difference of 0.070%), Taiwanese (17.6%, a difference of 0.070%), Immigrants from Latin America (17.6%, a difference of 0.10%), and Immigrants from Oceania (17.6%, a difference of 0.11%).
| Demographics | Rating | Rank | Cognitive Disability |
| Immigrants | Caribbean | 11.0 /100 | #203 | Poor 17.5% |
| Immigrants | Zimbabwe | 11.0 /100 | #204 | Poor 17.5% |
| Puget Sound Salish | 10.9 /100 | #205 | Poor 17.5% |
| Alaska Natives | 10.4 /100 | #206 | Poor 17.5% |
| Immigrants | Latin America | 9.7 /100 | #207 | Tragic 17.6% |
| Immigrants | Cameroon | 9.3 /100 | #208 | Tragic 17.6% |
| Immigrants | Trinidad and Tobago | 8.7 /100 | #209 | Tragic 17.6% |
| Immigrants | Jamaica | 8.5 /100 | #210 | Tragic 17.6% |
| Taiwanese | 7.7 /100 | #211 | Tragic 17.6% |
| Immigrants | Oceania | 7.3 /100 | #212 | Tragic 17.6% |
| Hawaiians | 7.2 /100 | #213 | Tragic 17.6% |
| Immigrants | El Salvador | 7.0 /100 | #214 | Tragic 17.6% |
| Alaskan Athabascans | 6.9 /100 | #215 | Tragic 17.6% |
| Okinawans | 6.8 /100 | #216 | Tragic 17.6% |
| Salvadorans | 6.7 /100 | #217 | Tragic 17.6% |
Demographics Similar to Armenians by Cognitive Disability
In terms of cognitive disability, the demographic groups most similar to Armenians are Yugoslavian (17.2%, a difference of 0.050%), Immigrants from Switzerland (17.2%, a difference of 0.050%), American (17.2%, a difference of 0.070%), Australian (17.2%, a difference of 0.080%), and Immigrants from Latvia (17.2%, a difference of 0.11%).
| Demographics | Rating | Rank | Cognitive Disability |
| Immigrants | Australia | 76.0 /100 | #157 | Good 17.1% |
| Celtics | 74.1 /100 | #158 | Good 17.1% |
| Immigrants | Latvia | 73.2 /100 | #159 | Good 17.2% |
| Australians | 72.4 /100 | #160 | Good 17.2% |
| Americans | 72.2 /100 | #161 | Good 17.2% |
| Yugoslavians | 71.6 /100 | #162 | Good 17.2% |
| Immigrants | Switzerland | 71.5 /100 | #163 | Good 17.2% |
| Armenians | 70.1 /100 | #164 | Good 17.2% |
| Immigrants | Albania | 64.9 /100 | #165 | Good 17.2% |
| Immigrants | Ecuador | 64.4 /100 | #166 | Good 17.2% |
| Immigrants | Syria | 63.5 /100 | #167 | Good 17.2% |
| Immigrants | Immigrants | 62.5 /100 | #168 | Good 17.2% |
| Immigrants | Portugal | 61.8 /100 | #169 | Good 17.2% |
| Ecuadorians | 59.6 /100 | #170 | Average 17.2% |
| Tlingit-Haida | 59.4 /100 | #171 | Average 17.2% |