Immigrants from South America vs Armenian Cognitive Disability
COMPARE
Immigrants from South America
Armenian
Cognitive Disability
Cognitive Disability Comparison
Immigrants from South America
Armenians
16.7%
COGNITIVE DISABILITY
98.8/ 100
METRIC RATING
92nd/ 347
METRIC RANK
17.2%
COGNITIVE DISABILITY
70.1/ 100
METRIC RATING
164th/ 347
METRIC RANK
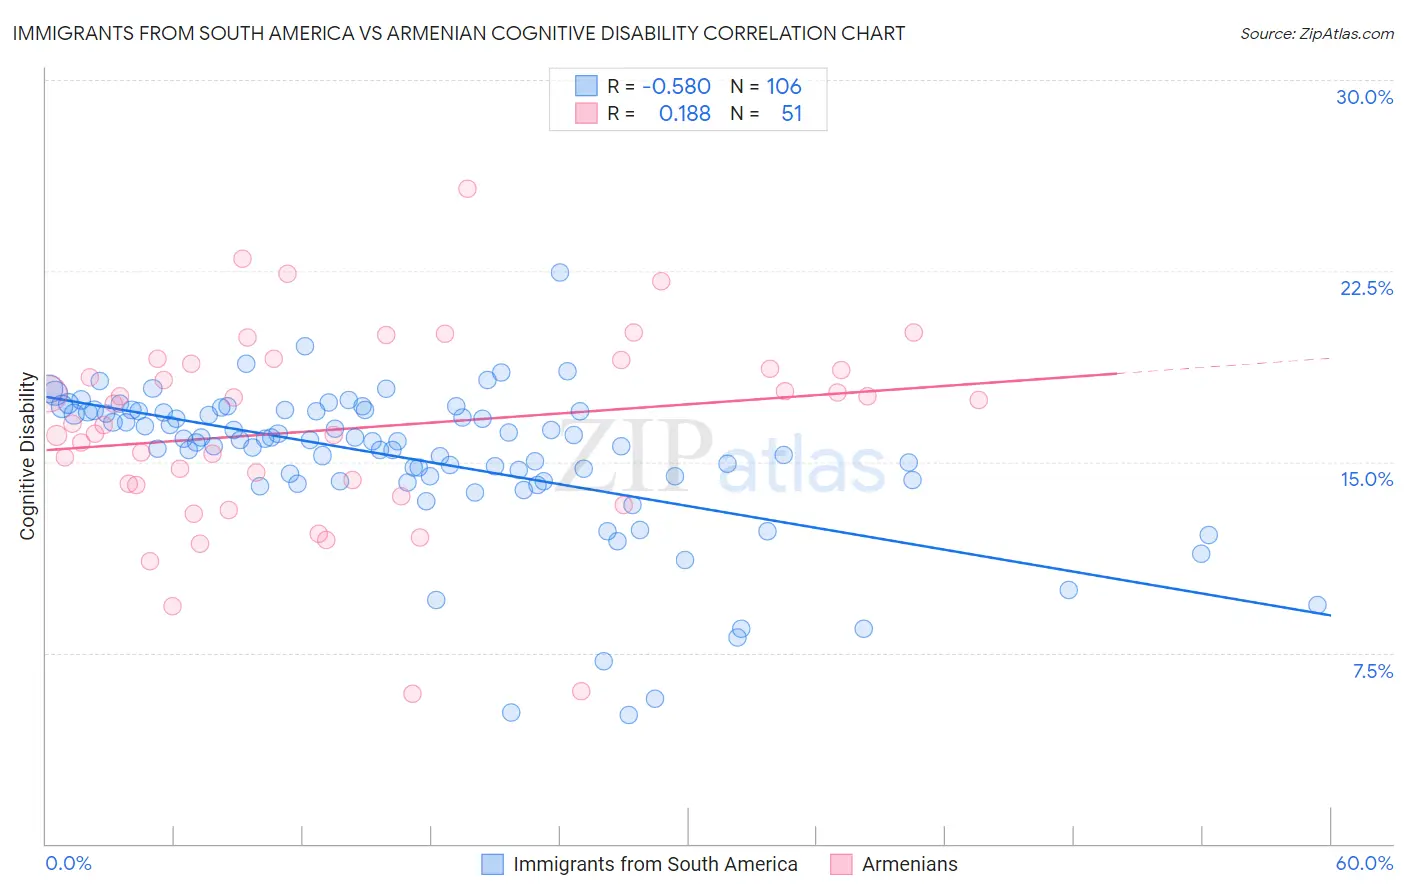
Immigrants from South America vs Armenian Cognitive Disability Correlation Chart
The statistical analysis conducted on geographies consisting of 486,335,122 people shows a substantial negative correlation between the proportion of Immigrants from South America and percentage of population with cognitive disability in the United States with a correlation coefficient (R) of -0.580 and weighted average of 16.7%. Similarly, the statistical analysis conducted on geographies consisting of 310,934,651 people shows a poor positive correlation between the proportion of Armenians and percentage of population with cognitive disability in the United States with a correlation coefficient (R) of 0.188 and weighted average of 17.2%, a difference of 2.6%.
Cognitive Disability Correlation Summary
| Measurement | Immigrants from South America | Armenian |
| Minimum | 5.1% | 5.9% |
| Maximum | 22.5% | 25.7% |
| Range | 17.4% | 19.9% |
| Mean | 15.1% | 16.3% |
| Median | 15.8% | 16.5% |
| Interquartile 25% (IQ1) | 14.2% | 14.1% |
| Interquartile 75% (IQ3) | 17.0% | 18.8% |
| Interquartile Range (IQR) | 2.8% | 4.8% |
| Standard Deviation (Sample) | 3.0% | 3.9% |
| Standard Deviation (Population) | 3.0% | 3.9% |
Similar Demographics by Cognitive Disability
Demographics Similar to Immigrants from South America by Cognitive Disability
In terms of cognitive disability, the demographic groups most similar to Immigrants from South America are Immigrants from Southern Europe (16.7%, a difference of 0.0%), Danish (16.7%, a difference of 0.010%), Immigrants from Egypt (16.7%, a difference of 0.020%), South American (16.7%, a difference of 0.020%), and Asian (16.7%, a difference of 0.050%).
| Demographics | Rating | Rank | Cognitive Disability |
| Immigrants | Moldova | 99.1 /100 | #85 | Exceptional 16.7% |
| Immigrants | South Africa | 99.0 /100 | #86 | Exceptional 16.7% |
| Native Hawaiians | 99.0 /100 | #87 | Exceptional 16.7% |
| Immigrants | Philippines | 99.0 /100 | #88 | Exceptional 16.7% |
| Immigrants | Egypt | 98.8 /100 | #89 | Exceptional 16.7% |
| South Americans | 98.8 /100 | #90 | Exceptional 16.7% |
| Danes | 98.8 /100 | #91 | Exceptional 16.7% |
| Immigrants | South America | 98.8 /100 | #92 | Exceptional 16.7% |
| Immigrants | Southern Europe | 98.7 /100 | #93 | Exceptional 16.7% |
| Asians | 98.7 /100 | #94 | Exceptional 16.7% |
| English | 98.6 /100 | #95 | Exceptional 16.8% |
| Finns | 98.5 /100 | #96 | Exceptional 16.8% |
| Dutch | 98.5 /100 | #97 | Exceptional 16.8% |
| Immigrants | Lebanon | 98.4 /100 | #98 | Exceptional 16.8% |
| Jordanians | 98.2 /100 | #99 | Exceptional 16.8% |
Demographics Similar to Armenians by Cognitive Disability
In terms of cognitive disability, the demographic groups most similar to Armenians are Yugoslavian (17.2%, a difference of 0.050%), Immigrants from Switzerland (17.2%, a difference of 0.050%), American (17.2%, a difference of 0.070%), Australian (17.2%, a difference of 0.080%), and Immigrants from Latvia (17.2%, a difference of 0.11%).
| Demographics | Rating | Rank | Cognitive Disability |
| Immigrants | Australia | 76.0 /100 | #157 | Good 17.1% |
| Celtics | 74.1 /100 | #158 | Good 17.1% |
| Immigrants | Latvia | 73.2 /100 | #159 | Good 17.2% |
| Australians | 72.4 /100 | #160 | Good 17.2% |
| Americans | 72.2 /100 | #161 | Good 17.2% |
| Yugoslavians | 71.6 /100 | #162 | Good 17.2% |
| Immigrants | Switzerland | 71.5 /100 | #163 | Good 17.2% |
| Armenians | 70.1 /100 | #164 | Good 17.2% |
| Immigrants | Albania | 64.9 /100 | #165 | Good 17.2% |
| Immigrants | Ecuador | 64.4 /100 | #166 | Good 17.2% |
| Immigrants | Syria | 63.5 /100 | #167 | Good 17.2% |
| Immigrants | Immigrants | 62.5 /100 | #168 | Good 17.2% |
| Immigrants | Portugal | 61.8 /100 | #169 | Good 17.2% |
| Ecuadorians | 59.6 /100 | #170 | Average 17.2% |
| Tlingit-Haida | 59.4 /100 | #171 | Average 17.2% |