South American Indian vs Immigrants from Ecuador Disability Age 65 to 74
COMPARE
South American Indian
Immigrants from Ecuador
Disability Age 65 to 74
Disability Age 65 to 74 Comparison
South American Indians
Immigrants from Ecuador
23.1%
DISABILITY AGE 65 TO 74
65.5/ 100
METRIC RATING
159th/ 347
METRIC RANK
23.7%
DISABILITY AGE 65 TO 74
23.9/ 100
METRIC RATING
201st/ 347
METRIC RANK
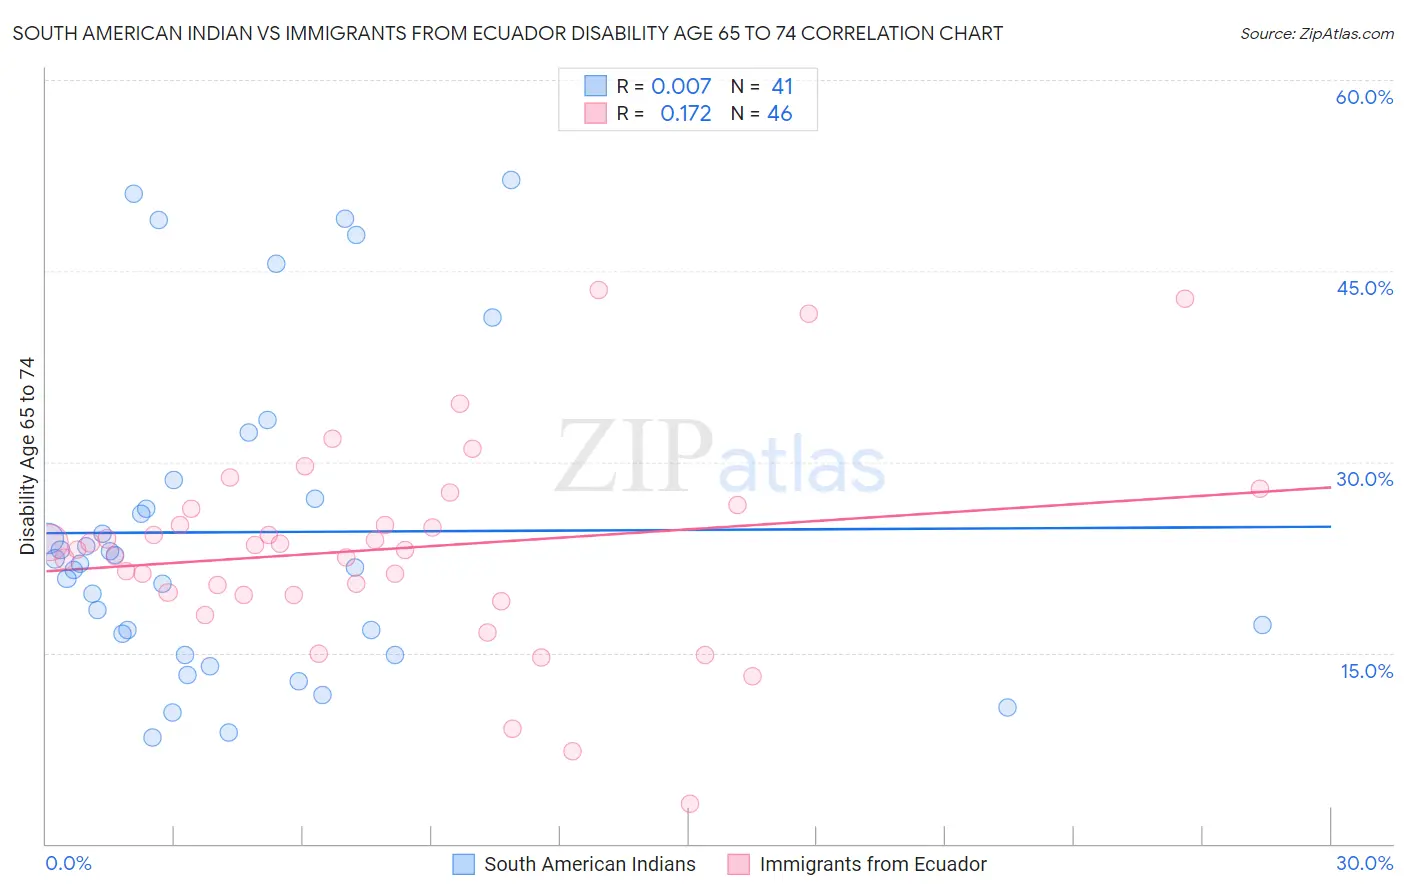
South American Indian vs Immigrants from Ecuador Disability Age 65 to 74 Correlation Chart
The statistical analysis conducted on geographies consisting of 164,502,257 people shows no correlation between the proportion of South American Indians and percentage of population with a disability between the ages 65 and 75 in the United States with a correlation coefficient (R) of 0.007 and weighted average of 23.1%. Similarly, the statistical analysis conducted on geographies consisting of 270,565,304 people shows a poor positive correlation between the proportion of Immigrants from Ecuador and percentage of population with a disability between the ages 65 and 75 in the United States with a correlation coefficient (R) of 0.172 and weighted average of 23.7%, a difference of 2.6%.
Disability Age 65 to 74 Correlation Summary
| Measurement | South American Indian | Immigrants from Ecuador |
| Minimum | 8.3% | 3.2% |
| Maximum | 52.2% | 43.5% |
| Range | 43.8% | 40.4% |
| Mean | 24.5% | 23.2% |
| Median | 22.0% | 23.3% |
| Interquartile 25% (IQ1) | 15.7% | 19.6% |
| Interquartile 75% (IQ3) | 27.9% | 26.3% |
| Interquartile Range (IQR) | 12.2% | 6.7% |
| Standard Deviation (Sample) | 12.4% | 8.0% |
| Standard Deviation (Population) | 12.2% | 7.9% |
Similar Demographics by Disability Age 65 to 74
Demographics Similar to South American Indians by Disability Age 65 to 74
In terms of disability age 65 to 74, the demographic groups most similar to South American Indians are Korean (23.1%, a difference of 0.090%), Immigrants from Cameroon (23.1%, a difference of 0.11%), Immigrants from Vietnam (23.1%, a difference of 0.24%), European (23.2%, a difference of 0.27%), and Immigrants from Philippines (23.2%, a difference of 0.27%).
| Demographics | Rating | Rank | Disability Age 65 to 74 |
| Finns | 76.5 /100 | #152 | Good 22.9% |
| Slavs | 75.2 /100 | #153 | Good 23.0% |
| Sri Lankans | 74.0 /100 | #154 | Good 23.0% |
| British | 73.9 /100 | #155 | Good 23.0% |
| Immigrants | Western Asia | 73.8 /100 | #156 | Good 23.0% |
| Czechoslovakians | 72.4 /100 | #157 | Good 23.0% |
| Immigrants | Vietnam | 69.1 /100 | #158 | Good 23.1% |
| South American Indians | 65.5 /100 | #159 | Good 23.1% |
| Koreans | 64.2 /100 | #160 | Good 23.1% |
| Immigrants | Cameroon | 63.8 /100 | #161 | Good 23.1% |
| Europeans | 61.2 /100 | #162 | Good 23.2% |
| Immigrants | Philippines | 61.1 /100 | #163 | Good 23.2% |
| Sierra Leoneans | 60.9 /100 | #164 | Good 23.2% |
| Vietnamese | 60.8 /100 | #165 | Good 23.2% |
| Immigrants | Afghanistan | 60.5 /100 | #166 | Good 23.2% |
Demographics Similar to Immigrants from Ecuador by Disability Age 65 to 74
In terms of disability age 65 to 74, the demographic groups most similar to Immigrants from Ecuador are French Canadian (23.7%, a difference of 0.010%), Immigrants from Africa (23.7%, a difference of 0.040%), Welsh (23.7%, a difference of 0.040%), Immigrants from Bahamas (23.7%, a difference of 0.040%), and Kenyan (23.7%, a difference of 0.050%).
| Demographics | Rating | Rank | Disability Age 65 to 74 |
| Sudanese | 27.8 /100 | #194 | Fair 23.7% |
| Immigrants | St. Vincent and the Grenadines | 26.1 /100 | #195 | Fair 23.7% |
| Immigrants | Trinidad and Tobago | 26.1 /100 | #196 | Fair 23.7% |
| Immigrants | Immigrants | 25.8 /100 | #197 | Fair 23.7% |
| Immigrants | Africa | 24.4 /100 | #198 | Fair 23.7% |
| Welsh | 24.3 /100 | #199 | Fair 23.7% |
| French Canadians | 24.0 /100 | #200 | Fair 23.7% |
| Immigrants | Ecuador | 23.9 /100 | #201 | Fair 23.7% |
| Immigrants | Bahamas | 23.3 /100 | #202 | Fair 23.7% |
| Kenyans | 23.2 /100 | #203 | Fair 23.7% |
| Immigrants | Grenada | 22.1 /100 | #204 | Fair 23.8% |
| Tongans | 20.8 /100 | #205 | Fair 23.8% |
| Immigrants | Jamaica | 20.7 /100 | #206 | Fair 23.8% |
| Immigrants | Sudan | 20.1 /100 | #207 | Fair 23.8% |
| Immigrants | Barbados | 19.6 /100 | #208 | Poor 23.8% |