South American Indian vs Yup'ik Disability Age 65 to 74
COMPARE
South American Indian
Yup'ik
Disability Age 65 to 74
Disability Age 65 to 74 Comparison
South American Indians
Yup'ik
23.1%
DISABILITY AGE 65 TO 74
65.5/ 100
METRIC RATING
159th/ 347
METRIC RANK
37.8%
DISABILITY AGE 65 TO 74
0.0/ 100
METRIC RATING
346th/ 347
METRIC RANK
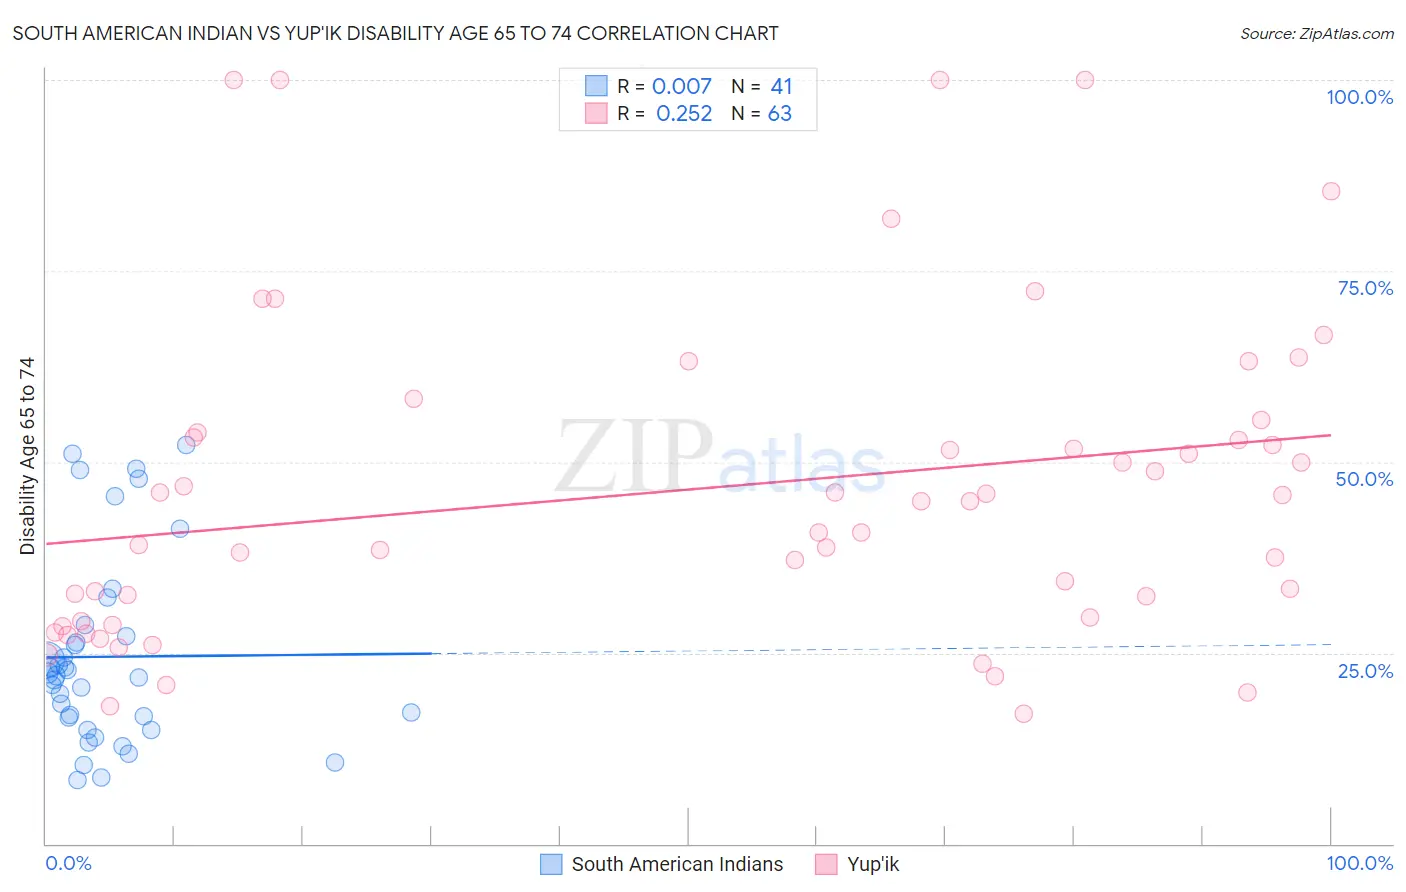
South American Indian vs Yup'ik Disability Age 65 to 74 Correlation Chart
The statistical analysis conducted on geographies consisting of 164,502,257 people shows no correlation between the proportion of South American Indians and percentage of population with a disability between the ages 65 and 75 in the United States with a correlation coefficient (R) of 0.007 and weighted average of 23.1%. Similarly, the statistical analysis conducted on geographies consisting of 39,932,947 people shows a weak positive correlation between the proportion of Yup'ik and percentage of population with a disability between the ages 65 and 75 in the United States with a correlation coefficient (R) of 0.252 and weighted average of 37.8%, a difference of 63.7%.
Disability Age 65 to 74 Correlation Summary
| Measurement | South American Indian | Yup'ik |
| Minimum | 8.3% | 16.9% |
| Maximum | 52.2% | 100.0% |
| Range | 43.8% | 83.1% |
| Mean | 24.5% | 46.4% |
| Median | 22.0% | 44.8% |
| Interquartile 25% (IQ1) | 15.7% | 29.1% |
| Interquartile 75% (IQ3) | 27.9% | 53.8% |
| Interquartile Range (IQR) | 12.2% | 24.8% |
| Standard Deviation (Sample) | 12.4% | 21.1% |
| Standard Deviation (Population) | 12.2% | 21.0% |
Similar Demographics by Disability Age 65 to 74
Demographics Similar to South American Indians by Disability Age 65 to 74
In terms of disability age 65 to 74, the demographic groups most similar to South American Indians are Korean (23.1%, a difference of 0.090%), Immigrants from Cameroon (23.1%, a difference of 0.11%), Immigrants from Vietnam (23.1%, a difference of 0.24%), European (23.2%, a difference of 0.27%), and Immigrants from Philippines (23.2%, a difference of 0.27%).
| Demographics | Rating | Rank | Disability Age 65 to 74 |
| Finns | 76.5 /100 | #152 | Good 22.9% |
| Slavs | 75.2 /100 | #153 | Good 23.0% |
| Sri Lankans | 74.0 /100 | #154 | Good 23.0% |
| British | 73.9 /100 | #155 | Good 23.0% |
| Immigrants | Western Asia | 73.8 /100 | #156 | Good 23.0% |
| Czechoslovakians | 72.4 /100 | #157 | Good 23.0% |
| Immigrants | Vietnam | 69.1 /100 | #158 | Good 23.1% |
| South American Indians | 65.5 /100 | #159 | Good 23.1% |
| Koreans | 64.2 /100 | #160 | Good 23.1% |
| Immigrants | Cameroon | 63.8 /100 | #161 | Good 23.1% |
| Europeans | 61.2 /100 | #162 | Good 23.2% |
| Immigrants | Philippines | 61.1 /100 | #163 | Good 23.2% |
| Sierra Leoneans | 60.9 /100 | #164 | Good 23.2% |
| Vietnamese | 60.8 /100 | #165 | Good 23.2% |
| Immigrants | Afghanistan | 60.5 /100 | #166 | Good 23.2% |
Demographics Similar to Yup'ik by Disability Age 65 to 74
In terms of disability age 65 to 74, the demographic groups most similar to Yup'ik are Pima (38.6%, a difference of 2.0%), Tohono O'odham (36.0%, a difference of 5.0%), Inupiat (34.5%, a difference of 9.6%), Navajo (33.3%, a difference of 13.5%), and Pueblo (33.1%, a difference of 14.3%).
| Demographics | Rating | Rank | Disability Age 65 to 74 |
| Colville | 0.0 /100 | #333 | Tragic 30.5% |
| Alaska Natives | 0.0 /100 | #334 | Tragic 30.6% |
| Cheyenne | 0.0 /100 | #335 | Tragic 31.1% |
| Yuman | 0.0 /100 | #336 | Tragic 31.5% |
| Houma | 0.0 /100 | #337 | Tragic 32.3% |
| Alaskan Athabascans | 0.0 /100 | #338 | Tragic 32.4% |
| Kiowa | 0.0 /100 | #339 | Tragic 32.6% |
| Lumbee | 0.0 /100 | #340 | Tragic 32.7% |
| Tsimshian | 0.0 /100 | #341 | Tragic 32.9% |
| Pueblo | 0.0 /100 | #342 | Tragic 33.1% |
| Navajo | 0.0 /100 | #343 | Tragic 33.3% |
| Inupiat | 0.0 /100 | #344 | Tragic 34.5% |
| Tohono O'odham | 0.0 /100 | #345 | Tragic 36.0% |
| Yup'ik | 0.0 /100 | #346 | Tragic 37.8% |
| Pima | 0.0 /100 | #347 | Tragic 38.6% |