Immigrants from Eastern Africa vs Immigrants from Ecuador Disability Age 65 to 74
COMPARE
Immigrants from Eastern Africa
Immigrants from Ecuador
Disability Age 65 to 74
Disability Age 65 to 74 Comparison
Immigrants from Eastern Africa
Immigrants from Ecuador
23.4%
DISABILITY AGE 65 TO 74
42.8/ 100
METRIC RATING
183rd/ 347
METRIC RANK
23.7%
DISABILITY AGE 65 TO 74
23.9/ 100
METRIC RATING
201st/ 347
METRIC RANK
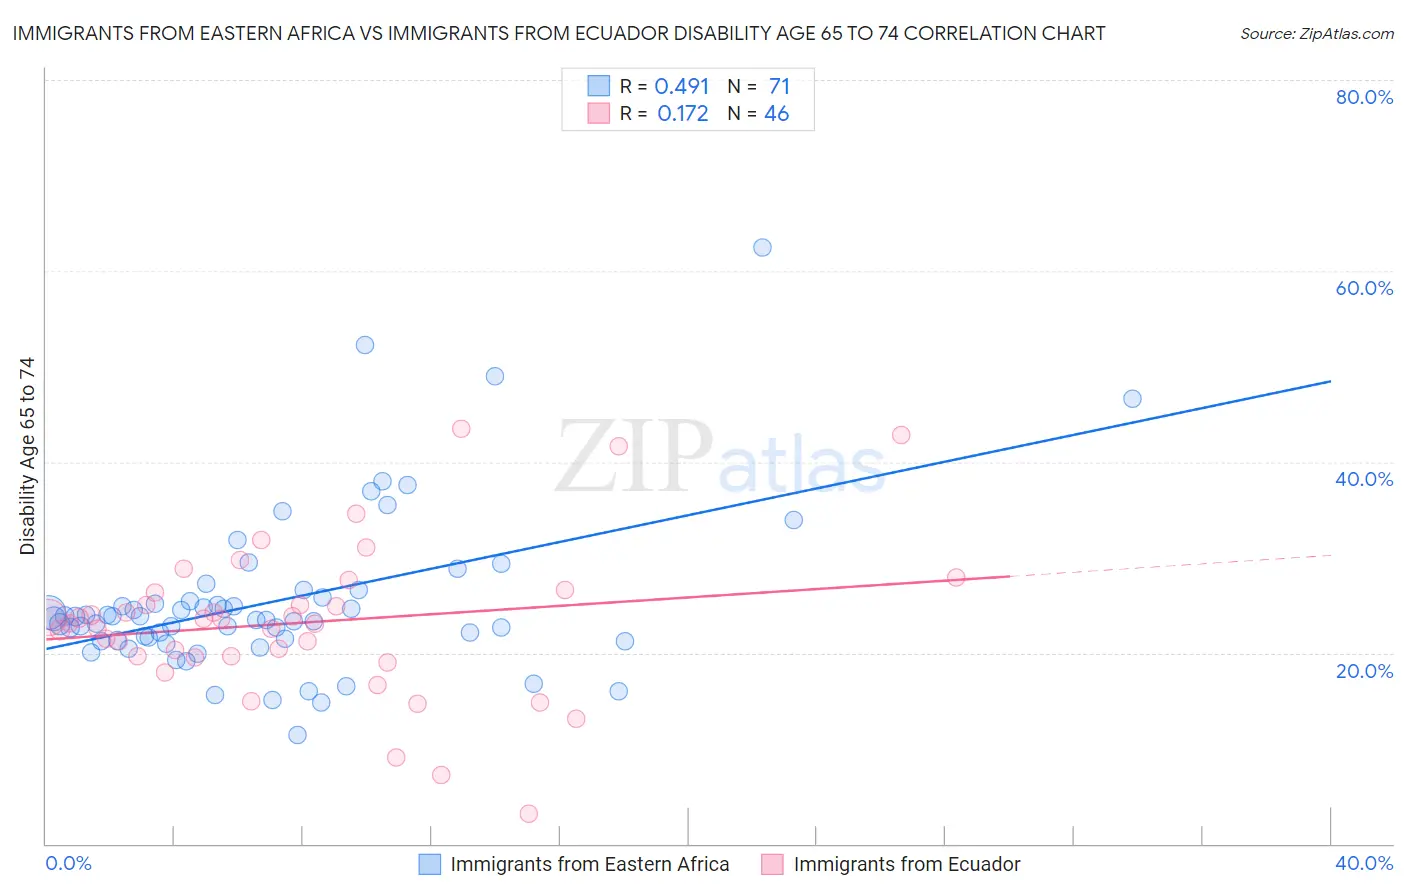
Immigrants from Eastern Africa vs Immigrants from Ecuador Disability Age 65 to 74 Correlation Chart
The statistical analysis conducted on geographies consisting of 354,483,487 people shows a moderate positive correlation between the proportion of Immigrants from Eastern Africa and percentage of population with a disability between the ages 65 and 75 in the United States with a correlation coefficient (R) of 0.491 and weighted average of 23.4%. Similarly, the statistical analysis conducted on geographies consisting of 270,565,304 people shows a poor positive correlation between the proportion of Immigrants from Ecuador and percentage of population with a disability between the ages 65 and 75 in the United States with a correlation coefficient (R) of 0.172 and weighted average of 23.7%, a difference of 1.3%.
Disability Age 65 to 74 Correlation Summary
| Measurement | Immigrants from Eastern Africa | Immigrants from Ecuador |
| Minimum | 11.3% | 3.2% |
| Maximum | 62.5% | 43.5% |
| Range | 51.2% | 40.4% |
| Mean | 25.4% | 23.2% |
| Median | 23.5% | 23.3% |
| Interquartile 25% (IQ1) | 21.3% | 19.6% |
| Interquartile 75% (IQ3) | 25.8% | 26.3% |
| Interquartile Range (IQR) | 4.5% | 6.7% |
| Standard Deviation (Sample) | 8.6% | 8.0% |
| Standard Deviation (Population) | 8.5% | 7.9% |
Demographics Similar to Immigrants from Eastern Africa and Immigrants from Ecuador by Disability Age 65 to 74
In terms of disability age 65 to 74, the demographic groups most similar to Immigrants from Eastern Africa are Immigrants from Germany (23.4%, a difference of 0.020%), Haitian (23.4%, a difference of 0.030%), Irish (23.4%, a difference of 0.090%), Basque (23.5%, a difference of 0.27%), and Portuguese (23.5%, a difference of 0.30%). Similarly, the demographic groups most similar to Immigrants from Ecuador are French Canadian (23.7%, a difference of 0.010%), Immigrants from Africa (23.7%, a difference of 0.040%), Welsh (23.7%, a difference of 0.040%), Immigrants from Bahamas (23.7%, a difference of 0.040%), and Immigrants (23.7%, a difference of 0.15%).
| Demographics | Rating | Rank | Disability Age 65 to 74 |
| Irish | 44.4 /100 | #182 | Average 23.4% |
| Immigrants | Eastern Africa | 42.8 /100 | #183 | Average 23.4% |
| Immigrants | Germany | 42.5 /100 | #184 | Average 23.4% |
| Haitians | 42.4 /100 | #185 | Average 23.4% |
| Basques | 38.4 /100 | #186 | Fair 23.5% |
| Portuguese | 37.8 /100 | #187 | Fair 23.5% |
| Immigrants | Cuba | 34.0 /100 | #188 | Fair 23.6% |
| Scottish | 33.1 /100 | #189 | Fair 23.6% |
| Immigrants | Guyana | 31.2 /100 | #190 | Fair 23.6% |
| Immigrants | Bangladesh | 30.2 /100 | #191 | Fair 23.6% |
| Ecuadorians | 29.7 /100 | #192 | Fair 23.6% |
| English | 28.5 /100 | #193 | Fair 23.6% |
| Sudanese | 27.8 /100 | #194 | Fair 23.7% |
| Immigrants | St. Vincent and the Grenadines | 26.1 /100 | #195 | Fair 23.7% |
| Immigrants | Trinidad and Tobago | 26.1 /100 | #196 | Fair 23.7% |
| Immigrants | Immigrants | 25.8 /100 | #197 | Fair 23.7% |
| Immigrants | Africa | 24.4 /100 | #198 | Fair 23.7% |
| Welsh | 24.3 /100 | #199 | Fair 23.7% |
| French Canadians | 24.0 /100 | #200 | Fair 23.7% |
| Immigrants | Ecuador | 23.9 /100 | #201 | Fair 23.7% |
| Immigrants | Bahamas | 23.3 /100 | #202 | Fair 23.7% |