South African vs Immigrants from Uganda Male Disability
COMPARE
South African
Immigrants from Uganda
Male Disability
Male Disability Comparison
South Africans
Immigrants from Uganda
11.0%
MALE DISABILITY
81.7/ 100
METRIC RATING
139th/ 347
METRIC RANK
10.8%
MALE DISABILITY
94.0/ 100
METRIC RATING
109th/ 347
METRIC RANK
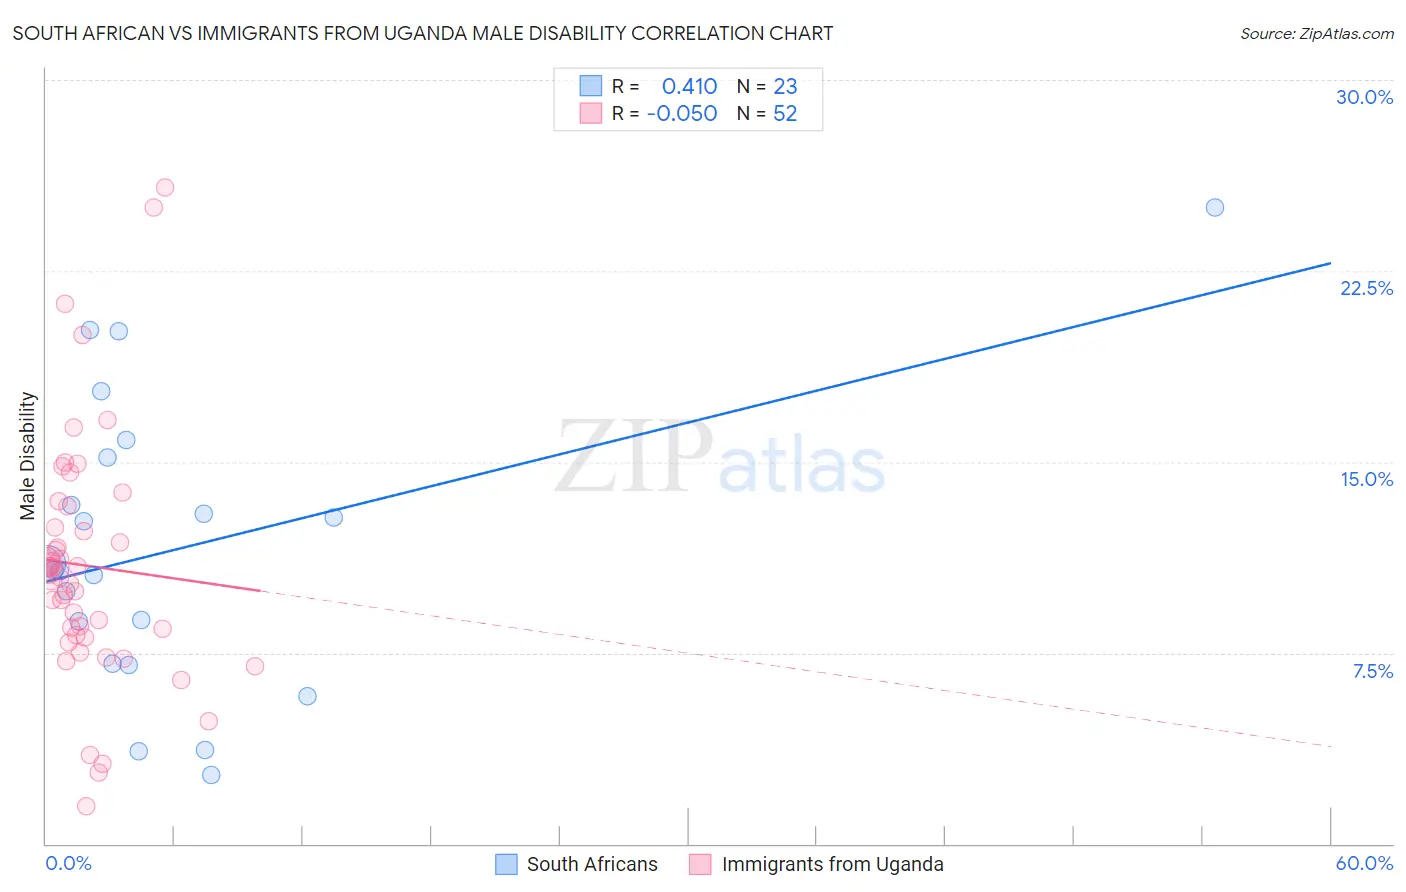
South African vs Immigrants from Uganda Male Disability Correlation Chart
The statistical analysis conducted on geographies consisting of 182,590,861 people shows a moderate positive correlation between the proportion of South Africans and percentage of males with a disability in the United States with a correlation coefficient (R) of 0.410 and weighted average of 11.0%. Similarly, the statistical analysis conducted on geographies consisting of 125,978,860 people shows a slight negative correlation between the proportion of Immigrants from Uganda and percentage of males with a disability in the United States with a correlation coefficient (R) of -0.050 and weighted average of 10.8%, a difference of 1.8%.
Male Disability Correlation Summary
| Measurement | South African | Immigrants from Uganda |
| Minimum | 2.7% | 1.5% |
| Maximum | 25.0% | 25.8% |
| Range | 22.3% | 24.3% |
| Mean | 11.6% | 10.9% |
| Median | 10.8% | 10.5% |
| Interquartile 25% (IQ1) | 7.1% | 8.2% |
| Interquartile 75% (IQ3) | 15.2% | 12.8% |
| Interquartile Range (IQR) | 8.1% | 4.7% |
| Standard Deviation (Sample) | 5.7% | 4.9% |
| Standard Deviation (Population) | 5.5% | 4.8% |
Similar Demographics by Male Disability
Demographics Similar to South Africans by Male Disability
In terms of male disability, the demographic groups most similar to South Africans are Nigerian (11.0%, a difference of 0.020%), Immigrants from Italy (11.0%, a difference of 0.020%), Arab (11.0%, a difference of 0.020%), Immigrants from Sudan (11.0%, a difference of 0.020%), and Immigrants from Europe (11.0%, a difference of 0.030%).
| Demographics | Rating | Rank | Male Disability |
| Immigrants | Fiji | 84.0 /100 | #132 | Excellent 11.0% |
| Ugandans | 83.9 /100 | #133 | Excellent 11.0% |
| Bhutanese | 83.4 /100 | #134 | Excellent 11.0% |
| Trinidadians and Tobagonians | 83.3 /100 | #135 | Excellent 11.0% |
| Immigrants | Costa Rica | 82.8 /100 | #136 | Excellent 11.0% |
| Immigrants | Europe | 82.0 /100 | #137 | Excellent 11.0% |
| Nigerians | 81.9 /100 | #138 | Excellent 11.0% |
| South Africans | 81.7 /100 | #139 | Excellent 11.0% |
| Immigrants | Italy | 81.5 /100 | #140 | Excellent 11.0% |
| Arabs | 81.5 /100 | #141 | Excellent 11.0% |
| Immigrants | Sudan | 81.5 /100 | #142 | Excellent 11.0% |
| Moroccans | 80.7 /100 | #143 | Excellent 11.0% |
| Kenyans | 78.1 /100 | #144 | Good 11.0% |
| Costa Ricans | 78.0 /100 | #145 | Good 11.0% |
| Koreans | 77.5 /100 | #146 | Good 11.0% |
Demographics Similar to Immigrants from Uganda by Male Disability
In terms of male disability, the demographic groups most similar to Immigrants from Uganda are Immigrants (10.8%, a difference of 0.030%), Immigrants from Belgium (10.8%, a difference of 0.050%), Immigrants from Uruguay (10.8%, a difference of 0.060%), Immigrants from Eastern Africa (10.8%, a difference of 0.070%), and Ghanaian (10.8%, a difference of 0.16%).
| Demographics | Rating | Rank | Male Disability |
| Immigrants | Eastern Europe | 95.3 /100 | #102 | Exceptional 10.7% |
| Uruguayans | 95.3 /100 | #103 | Exceptional 10.7% |
| Immigrants | Nigeria | 95.1 /100 | #104 | Exceptional 10.8% |
| Immigrants | Brazil | 95.0 /100 | #105 | Exceptional 10.8% |
| Immigrants | Syria | 94.9 /100 | #106 | Exceptional 10.8% |
| Immigrants | Eastern Africa | 94.3 /100 | #107 | Exceptional 10.8% |
| Immigrants | Belgium | 94.2 /100 | #108 | Exceptional 10.8% |
| Immigrants | Uganda | 94.0 /100 | #109 | Exceptional 10.8% |
| Immigrants | Immigrants | 93.9 /100 | #110 | Exceptional 10.8% |
| Immigrants | Uruguay | 93.8 /100 | #111 | Exceptional 10.8% |
| Ghanaians | 93.4 /100 | #112 | Exceptional 10.8% |
| Immigrants | Zimbabwe | 93.0 /100 | #113 | Exceptional 10.8% |
| Central Americans | 92.7 /100 | #114 | Exceptional 10.8% |
| Immigrants | Barbados | 92.2 /100 | #115 | Exceptional 10.8% |
| Immigrants | South Africa | 91.8 /100 | #116 | Exceptional 10.8% |