Sioux vs Immigrants from Peru Female Disability
COMPARE
Sioux
Immigrants from Peru
Female Disability
Female Disability Comparison
Sioux
Immigrants from Peru
12.9%
FEMALE DISABILITY
0.1/ 100
METRIC RATING
273rd/ 347
METRIC RANK
11.3%
FEMALE DISABILITY
99.9/ 100
METRIC RATING
52nd/ 347
METRIC RANK
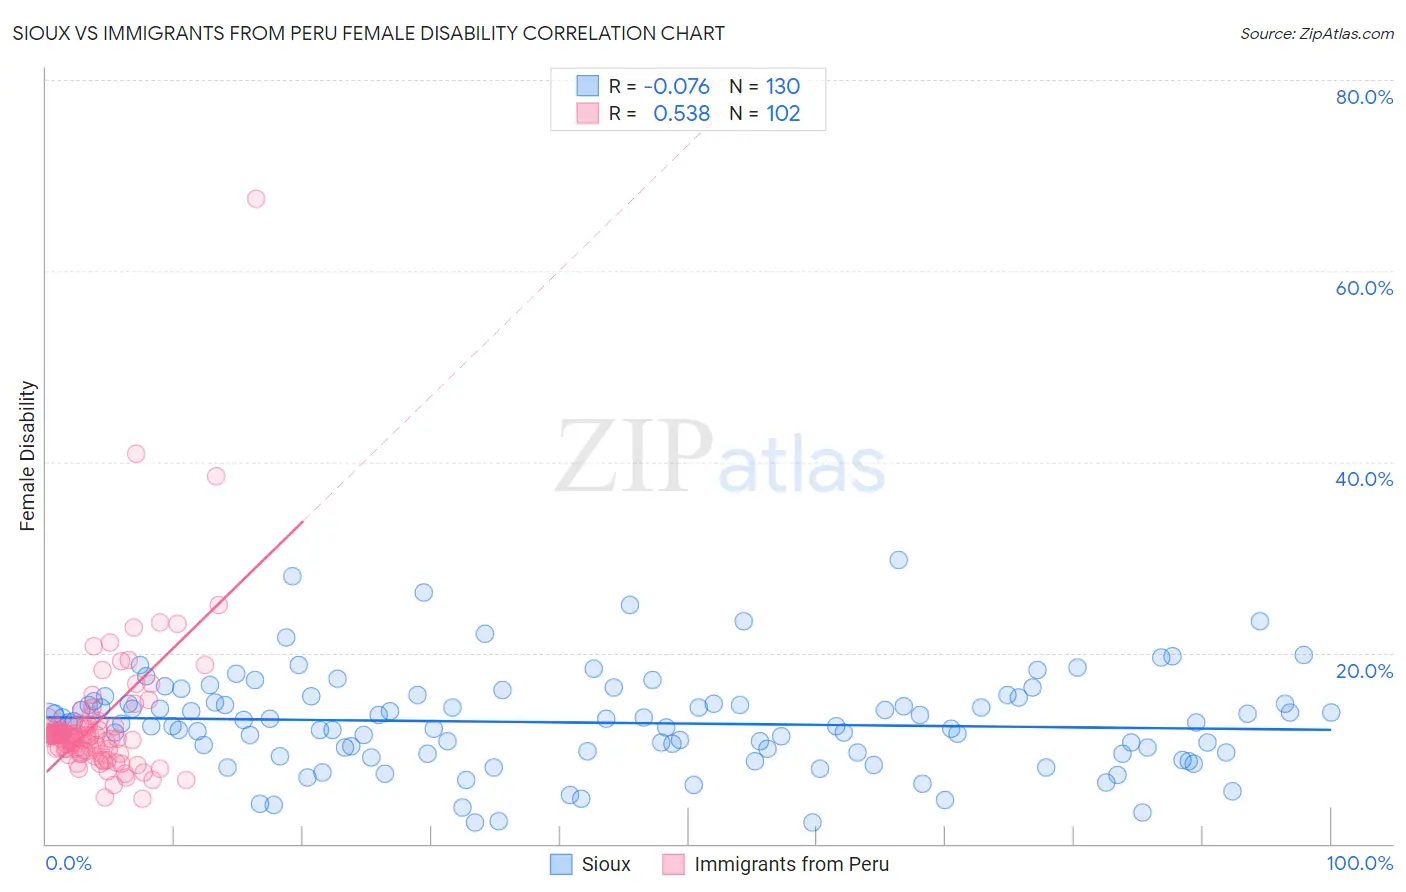
Sioux vs Immigrants from Peru Female Disability Correlation Chart
The statistical analysis conducted on geographies consisting of 234,143,610 people shows a slight negative correlation between the proportion of Sioux and percentage of females with a disability in the United States with a correlation coefficient (R) of -0.076 and weighted average of 12.9%. Similarly, the statistical analysis conducted on geographies consisting of 328,825,833 people shows a substantial positive correlation between the proportion of Immigrants from Peru and percentage of females with a disability in the United States with a correlation coefficient (R) of 0.538 and weighted average of 11.3%, a difference of 14.3%.
Female Disability Correlation Summary
| Measurement | Sioux | Immigrants from Peru |
| Minimum | 2.2% | 4.7% |
| Maximum | 29.8% | 67.6% |
| Range | 27.6% | 62.9% |
| Mean | 12.7% | 12.8% |
| Median | 12.7% | 11.3% |
| Interquartile 25% (IQ1) | 9.5% | 9.6% |
| Interquartile 75% (IQ3) | 15.0% | 12.4% |
| Interquartile Range (IQR) | 5.5% | 2.8% |
| Standard Deviation (Sample) | 5.1% | 7.7% |
| Standard Deviation (Population) | 5.1% | 7.7% |
Similar Demographics by Female Disability
Demographics Similar to Sioux by Female Disability
In terms of female disability, the demographic groups most similar to Sioux are German (12.9%, a difference of 0.020%), Portuguese (13.0%, a difference of 0.12%), Cheyenne (13.0%, a difference of 0.17%), Immigrants from Dominica (13.0%, a difference of 0.22%), and Dutch (12.9%, a difference of 0.23%).
| Demographics | Rating | Rank | Female Disability |
| Finns | 0.4 /100 | #266 | Tragic 12.8% |
| Senegalese | 0.4 /100 | #267 | Tragic 12.8% |
| Immigrants | Laos | 0.4 /100 | #268 | Tragic 12.8% |
| Indonesians | 0.4 /100 | #269 | Tragic 12.8% |
| Immigrants | Liberia | 0.3 /100 | #270 | Tragic 12.9% |
| Dutch | 0.2 /100 | #271 | Tragic 12.9% |
| Germans | 0.1 /100 | #272 | Tragic 12.9% |
| Sioux | 0.1 /100 | #273 | Tragic 12.9% |
| Portuguese | 0.1 /100 | #274 | Tragic 13.0% |
| Cheyenne | 0.1 /100 | #275 | Tragic 13.0% |
| Immigrants | Dominica | 0.1 /100 | #276 | Tragic 13.0% |
| Spanish | 0.1 /100 | #277 | Tragic 13.0% |
| Scottish | 0.1 /100 | #278 | Tragic 13.0% |
| Arapaho | 0.1 /100 | #279 | Tragic 13.0% |
| Irish | 0.1 /100 | #280 | Tragic 13.1% |
Demographics Similar to Immigrants from Peru by Female Disability
In terms of female disability, the demographic groups most similar to Immigrants from Peru are Immigrants from Saudi Arabia (11.3%, a difference of 0.040%), Peruvian (11.3%, a difference of 0.10%), Immigrants from Belgium (11.3%, a difference of 0.12%), Bulgarian (11.3%, a difference of 0.12%), and Inupiat (11.3%, a difference of 0.20%).
| Demographics | Rating | Rank | Female Disability |
| Immigrants | Sweden | 100.0 /100 | #45 | Exceptional 11.3% |
| Immigrants | Nepal | 100.0 /100 | #46 | Exceptional 11.3% |
| Jordanians | 100.0 /100 | #47 | Exceptional 11.3% |
| Zimbabweans | 100.0 /100 | #48 | Exceptional 11.3% |
| Tongans | 100.0 /100 | #49 | Exceptional 11.3% |
| Inupiat | 100.0 /100 | #50 | Exceptional 11.3% |
| Immigrants | Belgium | 100.0 /100 | #51 | Exceptional 11.3% |
| Immigrants | Peru | 99.9 /100 | #52 | Exceptional 11.3% |
| Immigrants | Saudi Arabia | 99.9 /100 | #53 | Exceptional 11.3% |
| Peruvians | 99.9 /100 | #54 | Exceptional 11.3% |
| Bulgarians | 99.9 /100 | #55 | Exceptional 11.3% |
| Taiwanese | 99.9 /100 | #56 | Exceptional 11.4% |
| South Americans | 99.9 /100 | #57 | Exceptional 11.4% |
| Laotians | 99.9 /100 | #58 | Exceptional 11.4% |
| Immigrants | Spain | 99.9 /100 | #59 | Exceptional 11.4% |