Scotch-Irish vs Macedonian Disability Age 35 to 64
COMPARE
Scotch-Irish
Macedonian
Disability Age 35 to 64
Disability Age 35 to 64 Comparison
Scotch-Irish
Macedonians
13.0%
DISABILITY AGE 35 TO 64
0.1/ 100
METRIC RATING
281st/ 347
METRIC RANK
10.4%
DISABILITY AGE 35 TO 64
97.8/ 100
METRIC RATING
105th/ 347
METRIC RANK
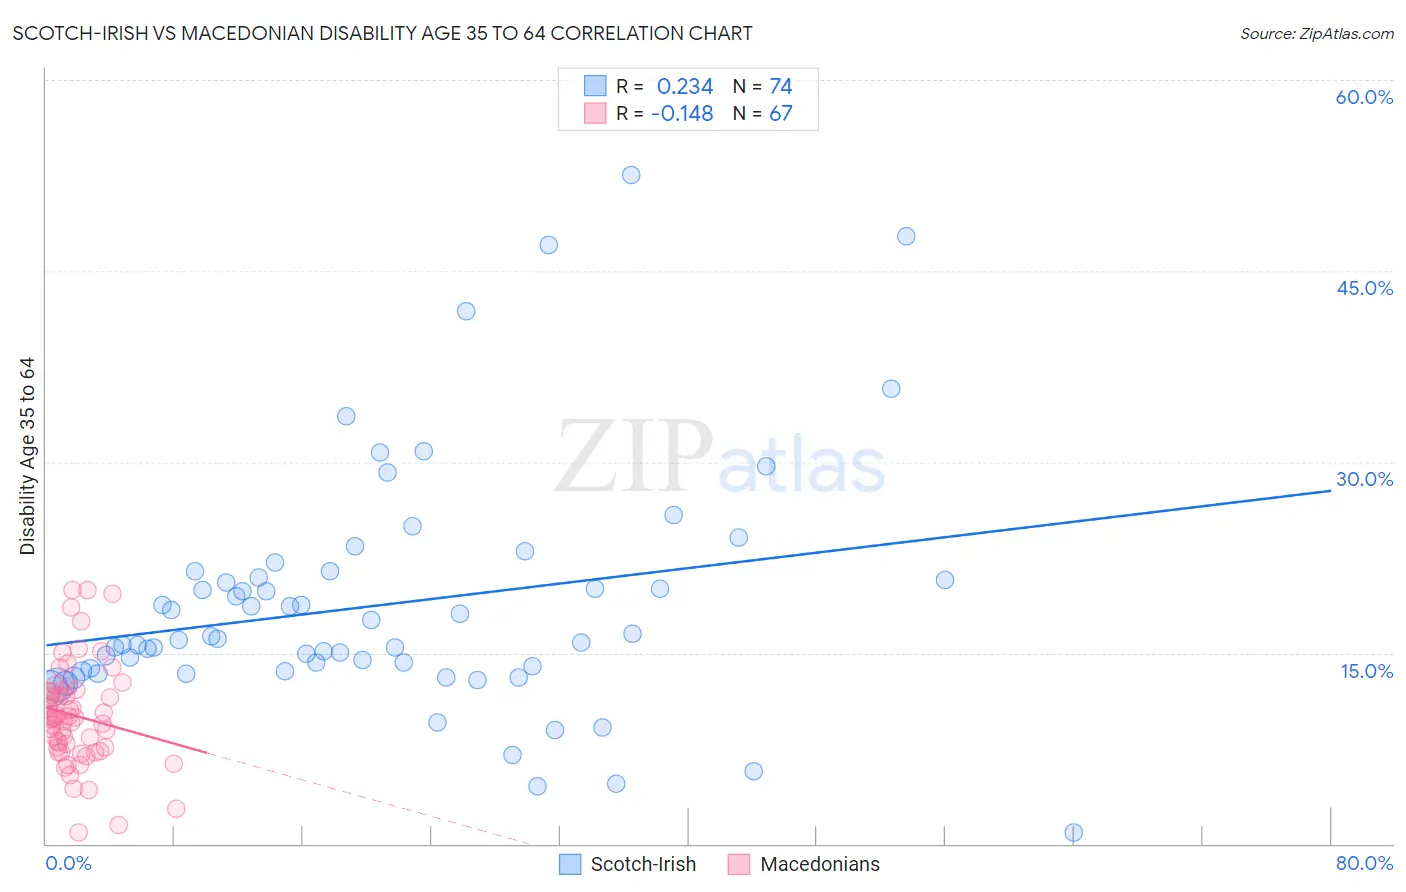
Scotch-Irish vs Macedonian Disability Age 35 to 64 Correlation Chart
The statistical analysis conducted on geographies consisting of 548,060,326 people shows a weak positive correlation between the proportion of Scotch-Irish and percentage of population with a disability between the ages 34 and 64 in the United States with a correlation coefficient (R) of 0.234 and weighted average of 13.0%. Similarly, the statistical analysis conducted on geographies consisting of 132,601,587 people shows a poor negative correlation between the proportion of Macedonians and percentage of population with a disability between the ages 34 and 64 in the United States with a correlation coefficient (R) of -0.148 and weighted average of 10.4%, a difference of 24.5%.
Disability Age 35 to 64 Correlation Summary
| Measurement | Scotch-Irish | Macedonian |
| Minimum | 0.87% | 0.93% |
| Maximum | 52.5% | 19.9% |
| Range | 51.7% | 19.0% |
| Mean | 18.7% | 10.1% |
| Median | 16.1% | 9.9% |
| Interquartile 25% (IQ1) | 13.6% | 7.5% |
| Interquartile 75% (IQ3) | 20.9% | 12.0% |
| Interquartile Range (IQR) | 7.3% | 4.4% |
| Standard Deviation (Sample) | 9.4% | 4.0% |
| Standard Deviation (Population) | 9.4% | 3.9% |
Similar Demographics by Disability Age 35 to 64
Demographics Similar to Scotch-Irish by Disability Age 35 to 64
In terms of disability age 35 to 64, the demographic groups most similar to Scotch-Irish are Immigrants from Laos (13.0%, a difference of 0.090%), Liberian (12.9%, a difference of 0.20%), Immigrants from Micronesia (12.9%, a difference of 0.36%), French Canadian (12.9%, a difference of 0.39%), and Immigrants from Dominican Republic (12.9%, a difference of 0.42%).
| Demographics | Rating | Rank | Disability Age 35 to 64 |
| Celtics | 0.1 /100 | #274 | Tragic 12.9% |
| Dominicans | 0.1 /100 | #275 | Tragic 12.9% |
| Somalis | 0.1 /100 | #276 | Tragic 12.9% |
| Immigrants | Dominican Republic | 0.1 /100 | #277 | Tragic 12.9% |
| French Canadians | 0.1 /100 | #278 | Tragic 12.9% |
| Immigrants | Micronesia | 0.1 /100 | #279 | Tragic 12.9% |
| Liberians | 0.1 /100 | #280 | Tragic 12.9% |
| Scotch-Irish | 0.1 /100 | #281 | Tragic 13.0% |
| Immigrants | Laos | 0.1 /100 | #282 | Tragic 13.0% |
| Central American Indians | 0.0 /100 | #283 | Tragic 13.0% |
| Immigrants | Nonimmigrants | 0.0 /100 | #284 | Tragic 13.0% |
| Immigrants | Somalia | 0.0 /100 | #285 | Tragic 13.1% |
| Hmong | 0.0 /100 | #286 | Tragic 13.1% |
| Tlingit-Haida | 0.0 /100 | #287 | Tragic 13.2% |
| Fijians | 0.0 /100 | #288 | Tragic 13.2% |
Demographics Similar to Macedonians by Disability Age 35 to 64
In terms of disability age 35 to 64, the demographic groups most similar to Macedonians are Immigrants from Austria (10.4%, a difference of 0.020%), Immigrants from Hungary (10.4%, a difference of 0.15%), Immigrants from Ukraine (10.4%, a difference of 0.16%), Immigrants from Western Asia (10.4%, a difference of 0.19%), and Immigrants from Philippines (10.4%, a difference of 0.26%).
| Demographics | Rating | Rank | Disability Age 35 to 64 |
| Immigrants | Uruguay | 98.3 /100 | #98 | Exceptional 10.3% |
| Palestinians | 98.2 /100 | #99 | Exceptional 10.4% |
| Immigrants | Jordan | 98.1 /100 | #100 | Exceptional 10.4% |
| Immigrants | Philippines | 98.0 /100 | #101 | Exceptional 10.4% |
| Immigrants | Western Asia | 98.0 /100 | #102 | Exceptional 10.4% |
| Immigrants | Ukraine | 97.9 /100 | #103 | Exceptional 10.4% |
| Immigrants | Austria | 97.8 /100 | #104 | Exceptional 10.4% |
| Macedonians | 97.8 /100 | #105 | Exceptional 10.4% |
| Immigrants | Hungary | 97.6 /100 | #106 | Exceptional 10.4% |
| Zimbabweans | 97.4 /100 | #107 | Exceptional 10.4% |
| Ethiopians | 97.4 /100 | #108 | Exceptional 10.5% |
| Immigrants | Ethiopia | 97.2 /100 | #109 | Exceptional 10.5% |
| Koreans | 97.1 /100 | #110 | Exceptional 10.5% |
| Brazilians | 96.9 /100 | #111 | Exceptional 10.5% |
| Assyrians/Chaldeans/Syriacs | 96.8 /100 | #112 | Exceptional 10.5% |