Scotch-Irish vs Egyptian Disability Age 35 to 64
COMPARE
Scotch-Irish
Egyptian
Disability Age 35 to 64
Disability Age 35 to 64 Comparison
Scotch-Irish
Egyptians
13.0%
DISABILITY AGE 35 TO 64
0.1/ 100
METRIC RATING
281st/ 347
METRIC RANK
9.7%
DISABILITY AGE 35 TO 64
99.9/ 100
METRIC RATING
38th/ 347
METRIC RANK
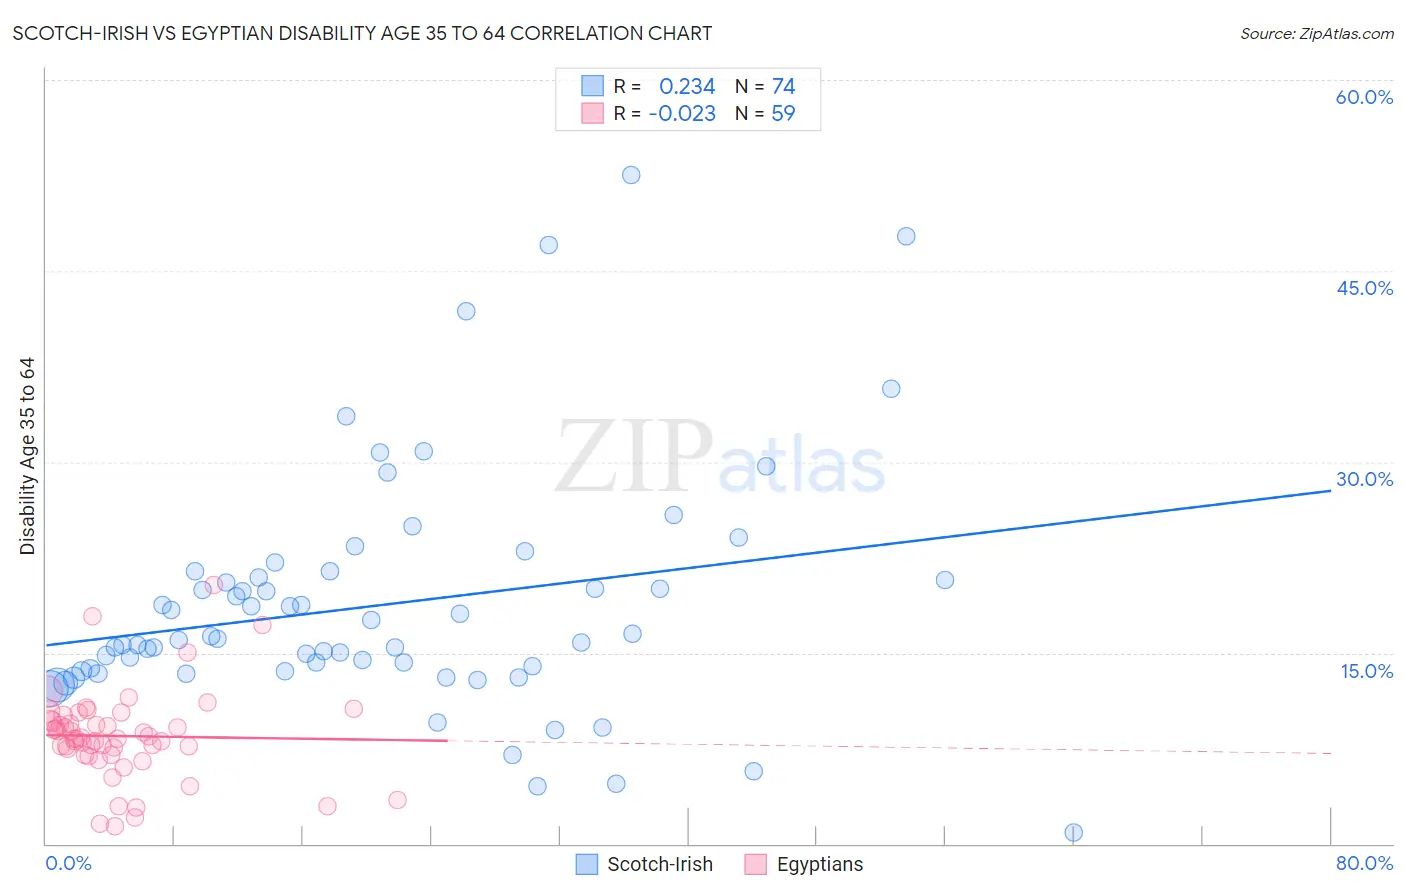
Scotch-Irish vs Egyptian Disability Age 35 to 64 Correlation Chart
The statistical analysis conducted on geographies consisting of 548,060,326 people shows a weak positive correlation between the proportion of Scotch-Irish and percentage of population with a disability between the ages 34 and 64 in the United States with a correlation coefficient (R) of 0.234 and weighted average of 13.0%. Similarly, the statistical analysis conducted on geographies consisting of 276,747,097 people shows no correlation between the proportion of Egyptians and percentage of population with a disability between the ages 34 and 64 in the United States with a correlation coefficient (R) of -0.023 and weighted average of 9.7%, a difference of 33.8%.
Disability Age 35 to 64 Correlation Summary
| Measurement | Scotch-Irish | Egyptian |
| Minimum | 0.87% | 1.4% |
| Maximum | 52.5% | 20.3% |
| Range | 51.7% | 18.9% |
| Mean | 18.7% | 8.5% |
| Median | 16.1% | 8.3% |
| Interquartile 25% (IQ1) | 13.6% | 7.0% |
| Interquartile 75% (IQ3) | 20.9% | 9.7% |
| Interquartile Range (IQR) | 7.3% | 2.7% |
| Standard Deviation (Sample) | 9.4% | 3.5% |
| Standard Deviation (Population) | 9.4% | 3.5% |
Similar Demographics by Disability Age 35 to 64
Demographics Similar to Scotch-Irish by Disability Age 35 to 64
In terms of disability age 35 to 64, the demographic groups most similar to Scotch-Irish are Immigrants from Laos (13.0%, a difference of 0.090%), Liberian (12.9%, a difference of 0.20%), Immigrants from Micronesia (12.9%, a difference of 0.36%), French Canadian (12.9%, a difference of 0.39%), and Immigrants from Dominican Republic (12.9%, a difference of 0.42%).
| Demographics | Rating | Rank | Disability Age 35 to 64 |
| Celtics | 0.1 /100 | #274 | Tragic 12.9% |
| Dominicans | 0.1 /100 | #275 | Tragic 12.9% |
| Somalis | 0.1 /100 | #276 | Tragic 12.9% |
| Immigrants | Dominican Republic | 0.1 /100 | #277 | Tragic 12.9% |
| French Canadians | 0.1 /100 | #278 | Tragic 12.9% |
| Immigrants | Micronesia | 0.1 /100 | #279 | Tragic 12.9% |
| Liberians | 0.1 /100 | #280 | Tragic 12.9% |
| Scotch-Irish | 0.1 /100 | #281 | Tragic 13.0% |
| Immigrants | Laos | 0.1 /100 | #282 | Tragic 13.0% |
| Central American Indians | 0.0 /100 | #283 | Tragic 13.0% |
| Immigrants | Nonimmigrants | 0.0 /100 | #284 | Tragic 13.0% |
| Immigrants | Somalia | 0.0 /100 | #285 | Tragic 13.1% |
| Hmong | 0.0 /100 | #286 | Tragic 13.1% |
| Tlingit-Haida | 0.0 /100 | #287 | Tragic 13.2% |
| Fijians | 0.0 /100 | #288 | Tragic 13.2% |
Demographics Similar to Egyptians by Disability Age 35 to 64
In terms of disability age 35 to 64, the demographic groups most similar to Egyptians are Immigrants from Turkey (9.7%, a difference of 0.070%), Immigrants from Cuba (9.7%, a difference of 0.15%), Immigrants from Belarus (9.7%, a difference of 0.17%), Bulgarian (9.7%, a difference of 0.18%), and Immigrants from Armenia (9.7%, a difference of 0.23%).
| Demographics | Rating | Rank | Disability Age 35 to 64 |
| Immigrants | Lithuania | 99.9 /100 | #31 | Exceptional 9.6% |
| Turks | 99.9 /100 | #32 | Exceptional 9.7% |
| Immigrants | Indonesia | 99.9 /100 | #33 | Exceptional 9.7% |
| Immigrants | Australia | 99.9 /100 | #34 | Exceptional 9.7% |
| Bulgarians | 99.9 /100 | #35 | Exceptional 9.7% |
| Immigrants | Cuba | 99.9 /100 | #36 | Exceptional 9.7% |
| Immigrants | Turkey | 99.9 /100 | #37 | Exceptional 9.7% |
| Egyptians | 99.9 /100 | #38 | Exceptional 9.7% |
| Immigrants | Belarus | 99.9 /100 | #39 | Exceptional 9.7% |
| Immigrants | Armenia | 99.9 /100 | #40 | Exceptional 9.7% |
| Israelis | 99.9 /100 | #41 | Exceptional 9.7% |
| Immigrants | Malaysia | 99.9 /100 | #42 | Exceptional 9.7% |
| Immigrants | Colombia | 99.9 /100 | #43 | Exceptional 9.8% |
| Immigrants | Egypt | 99.9 /100 | #44 | Exceptional 9.8% |
| Immigrants | Peru | 99.9 /100 | #45 | Exceptional 9.8% |